| Version 35 (modified by , 15 years ago) ( diff ) |
|---|
April 5, 2012
Detrend plan
- Construct new "A" dark for dates 2010-01-23 - 2011-05-01.
- Register "B" dark for B-mode dates between 2010-01-23 - 2011-05-01 (table attached below).
- Construct three new darks: 2011-05-01 - 2011-08-01; 2011-08-01 - 2011-11-01; 2011-11-01 - 2012-04-01. These will minimize the dateobs trend observed over this range.
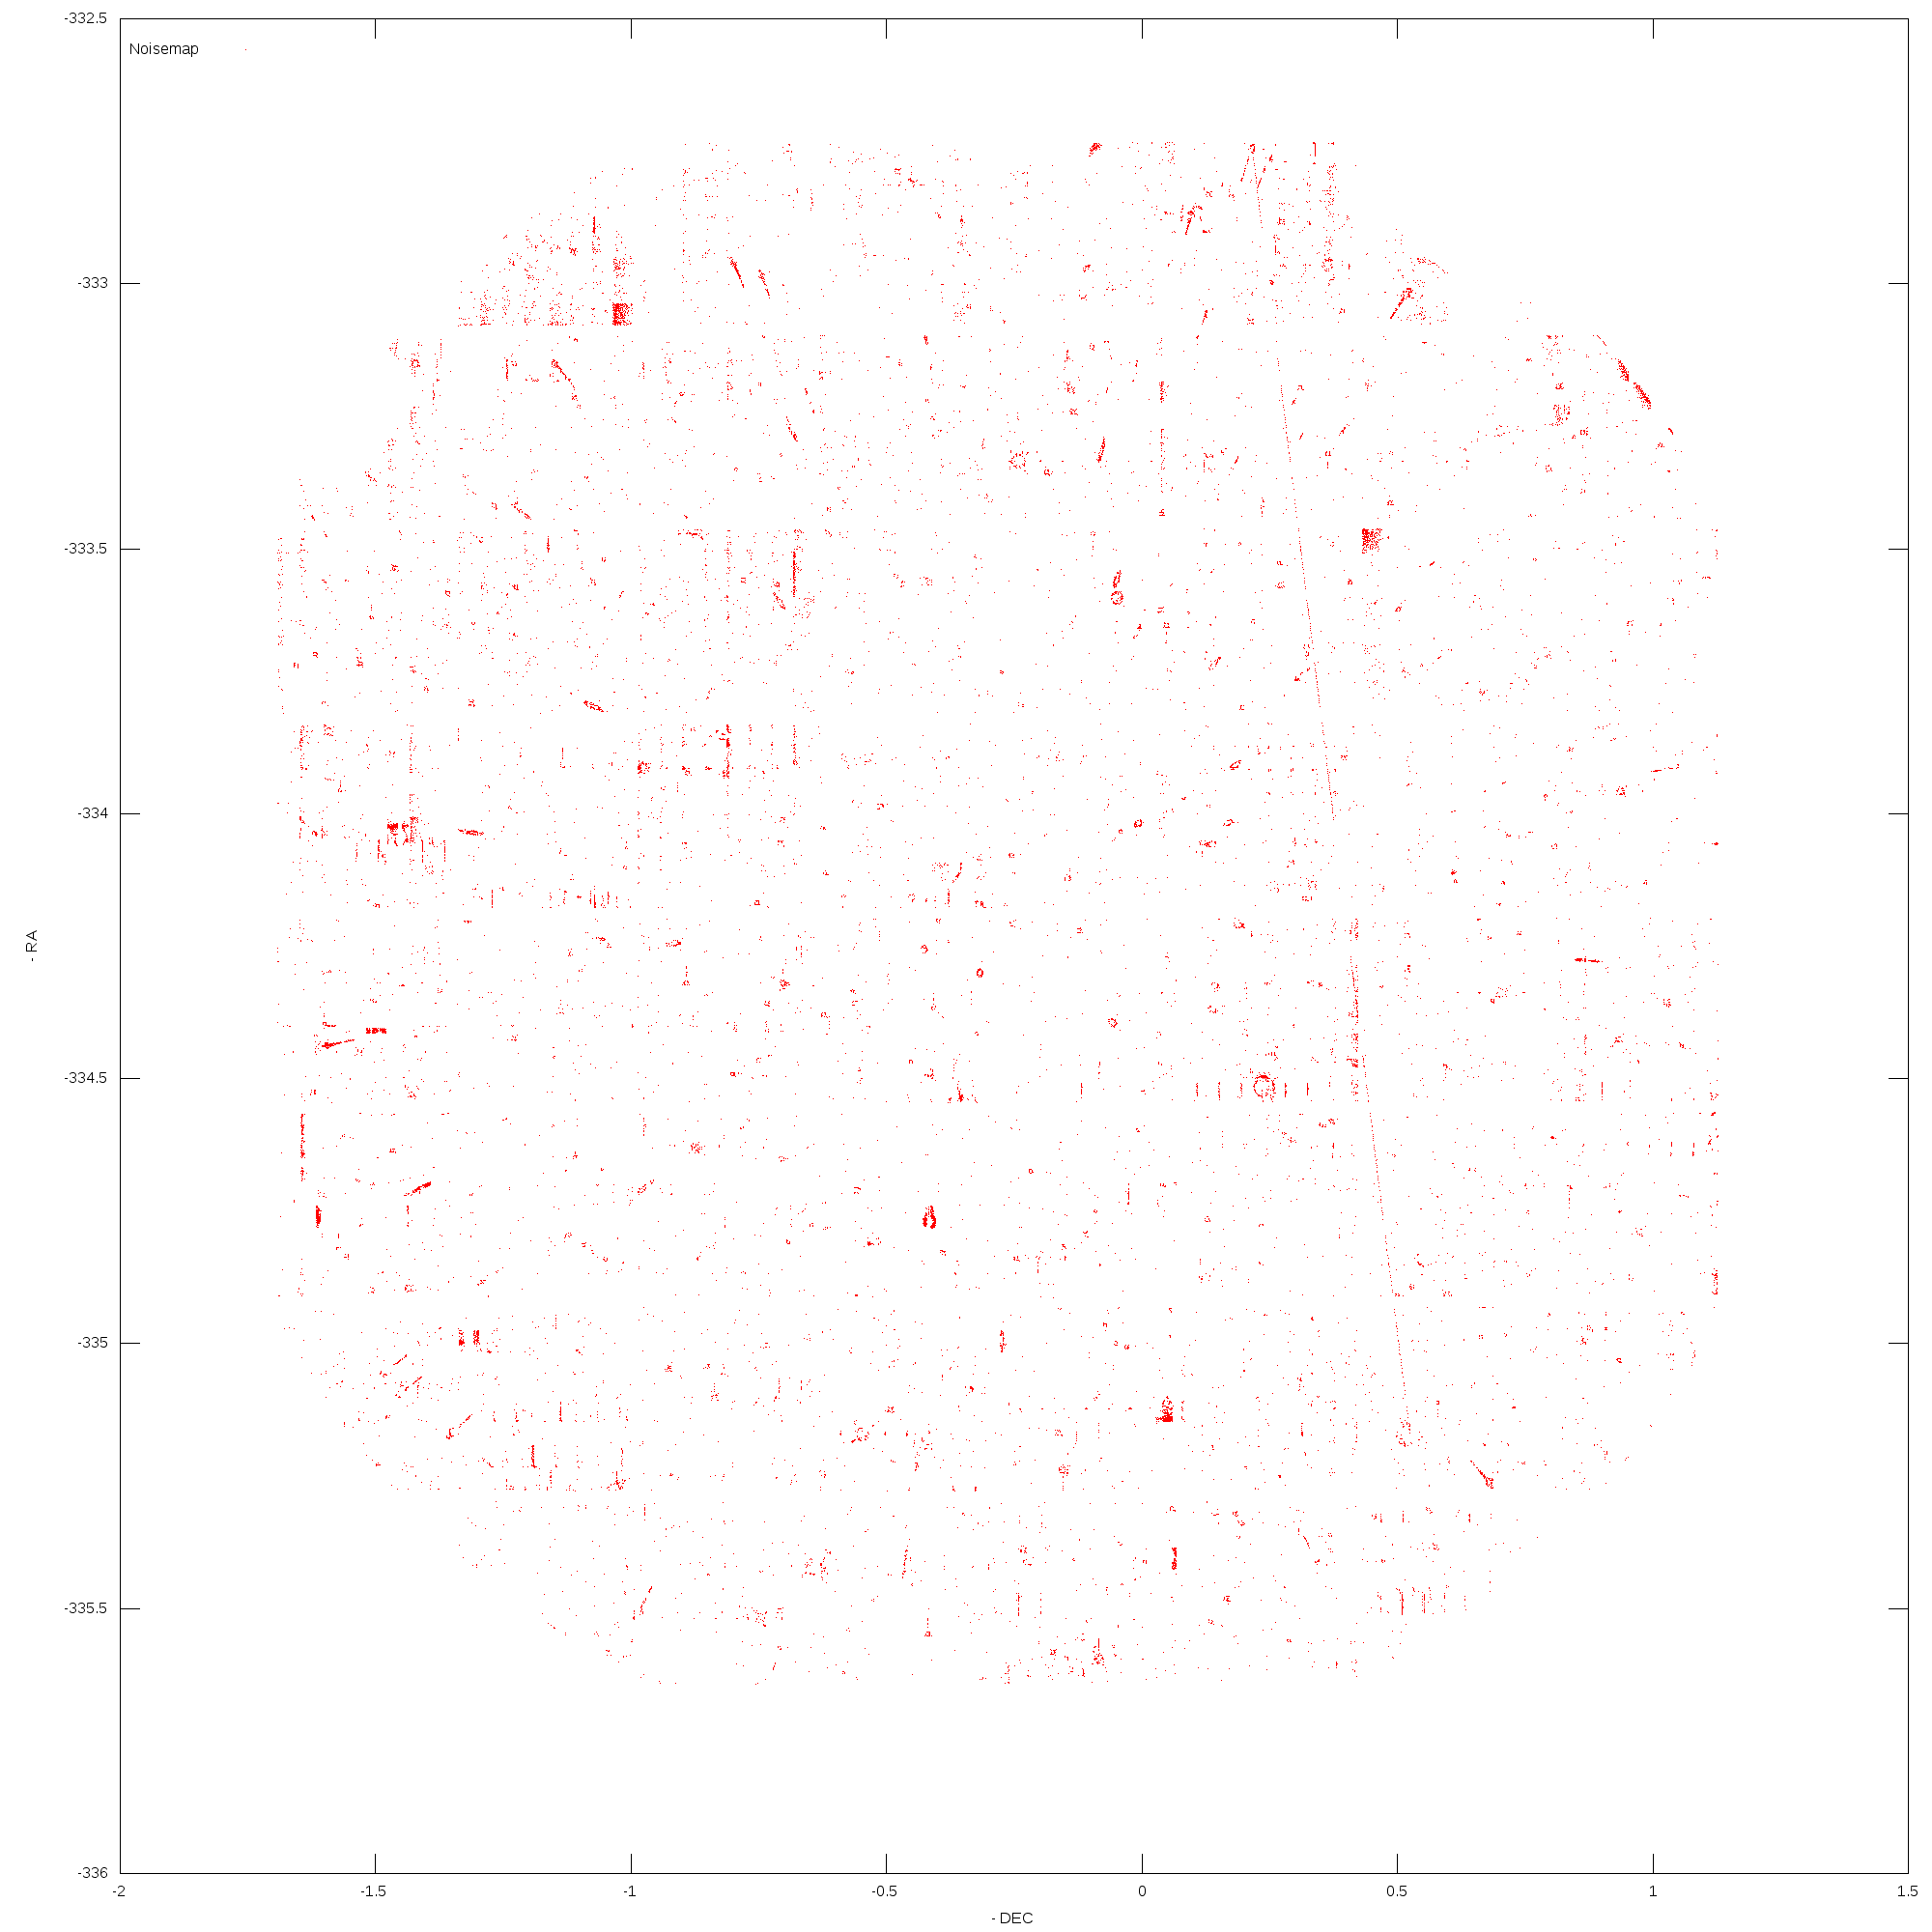
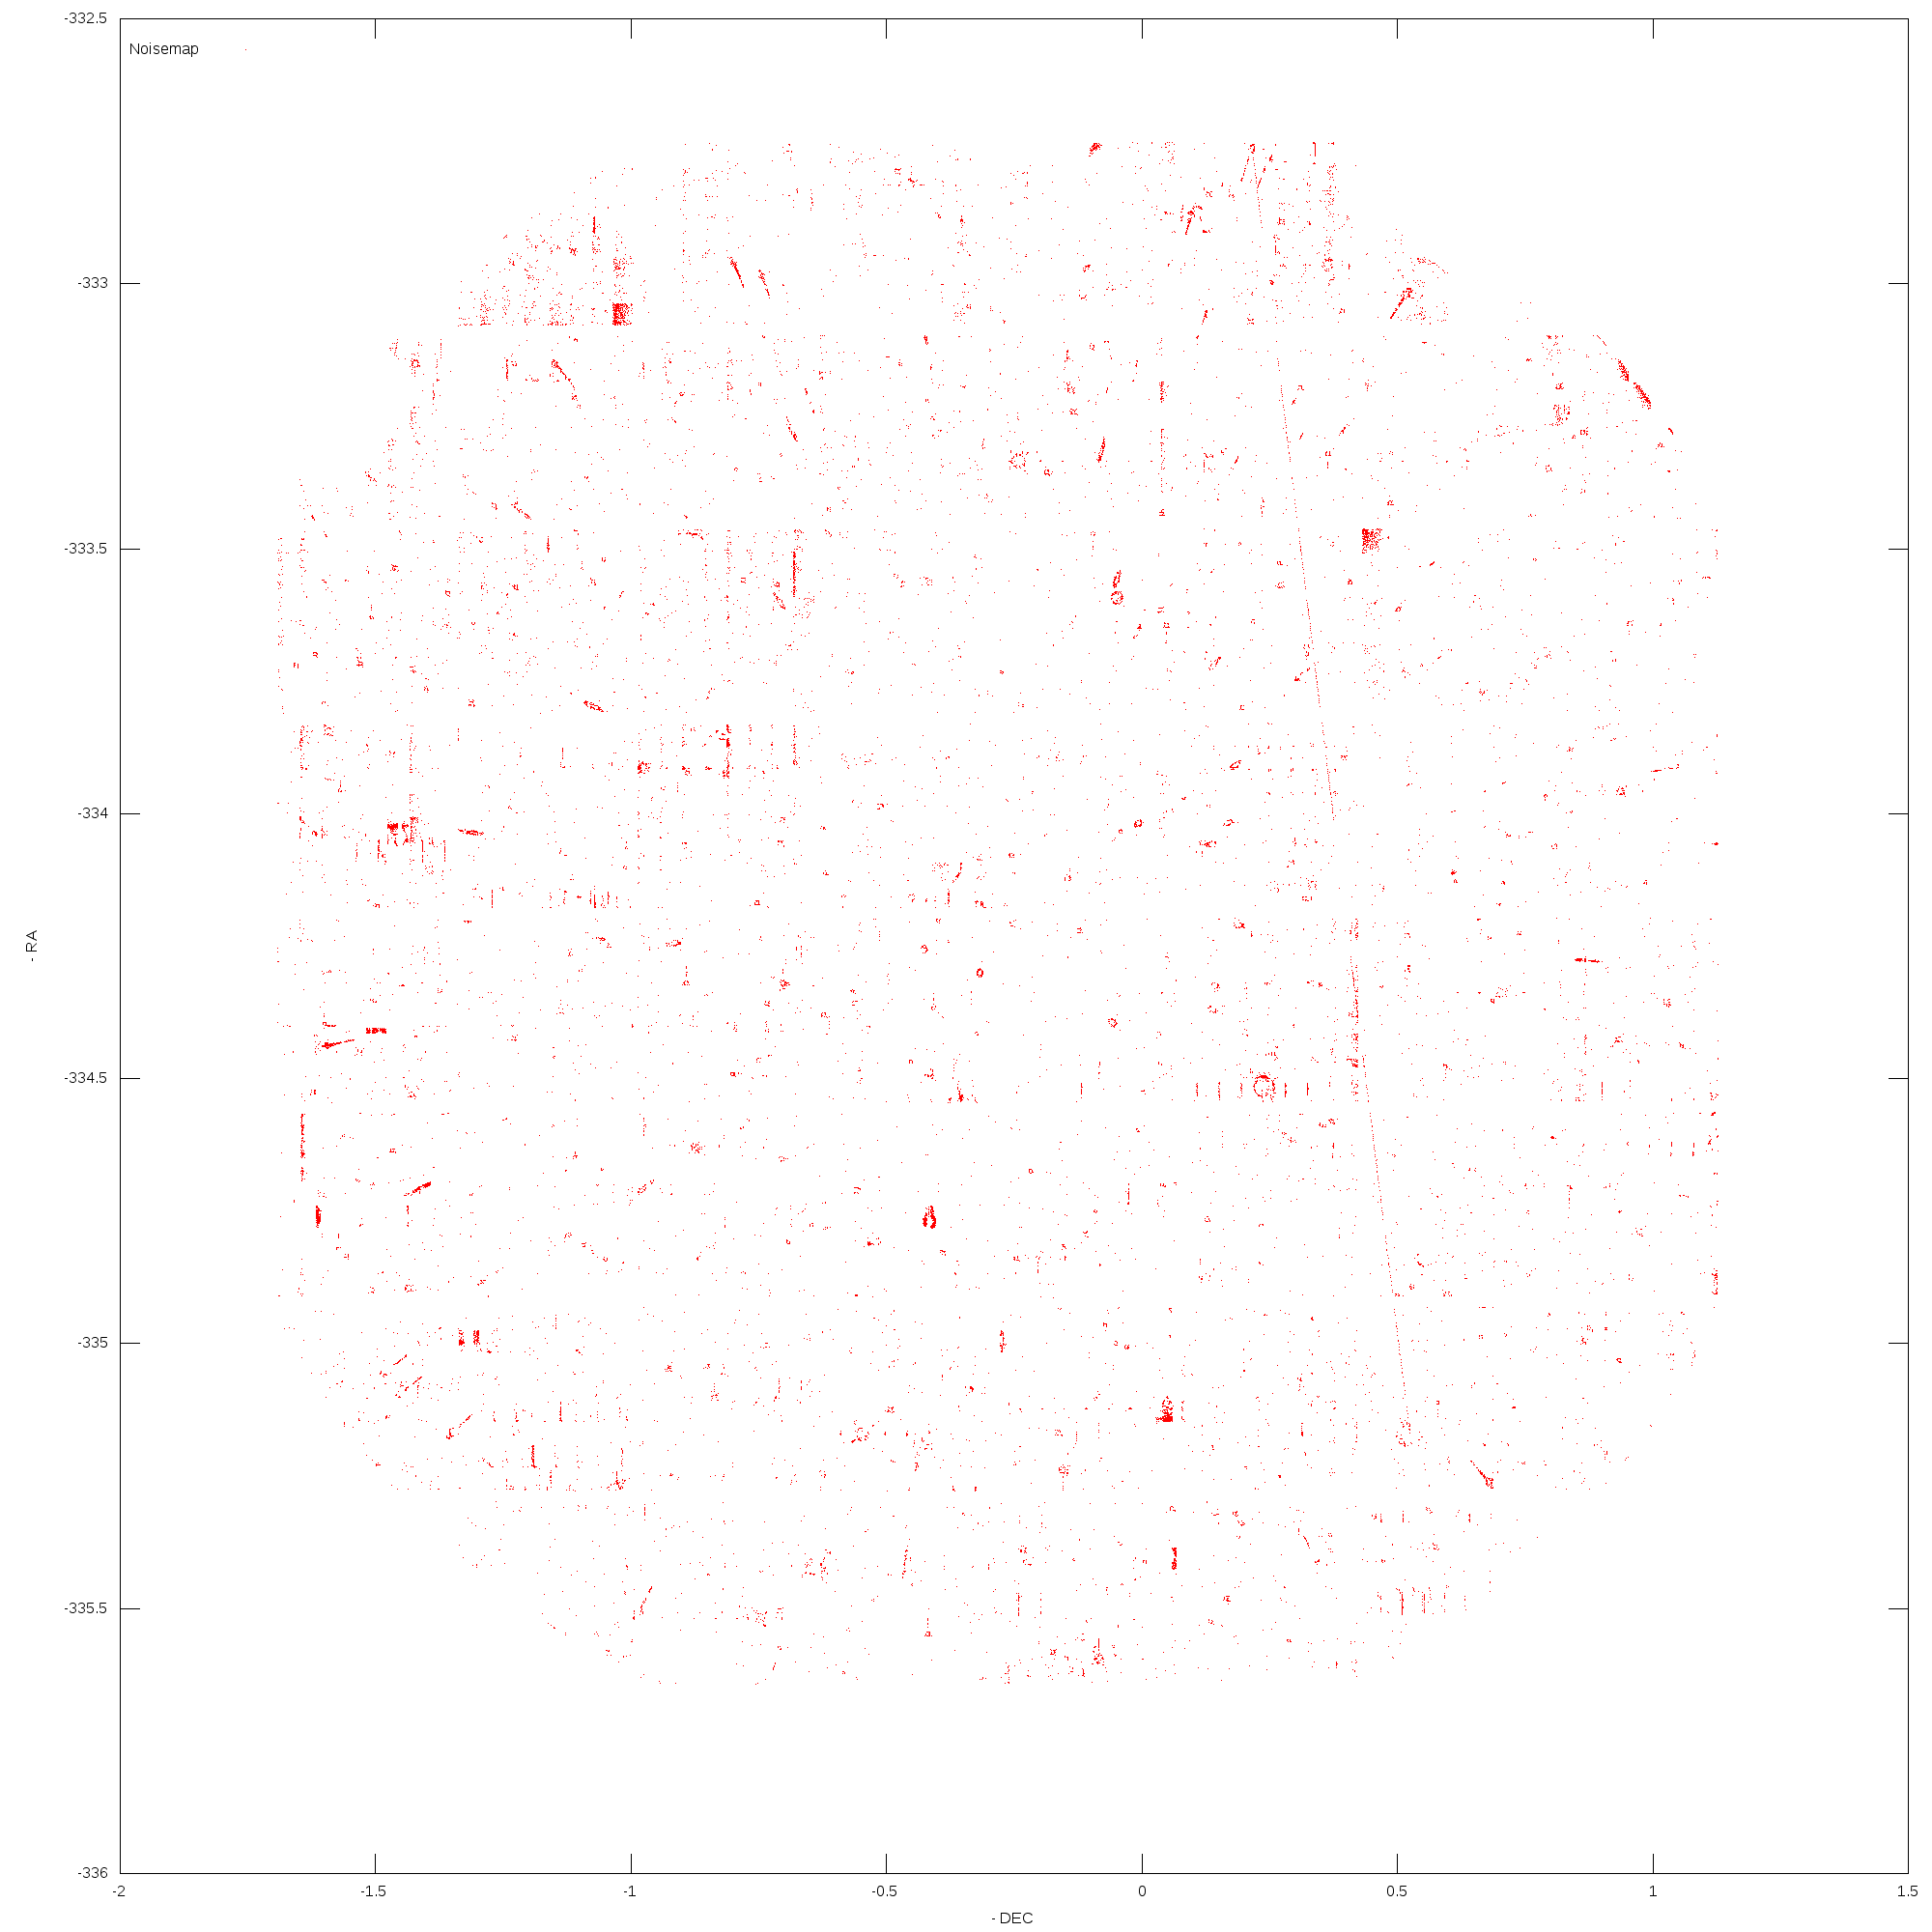
- Construct noisemaps for 2009-01-01 - 2010-09-01; 2010-09-01 - 2011-05-01 to match the variance shifts shown below.
Fixed Gain test
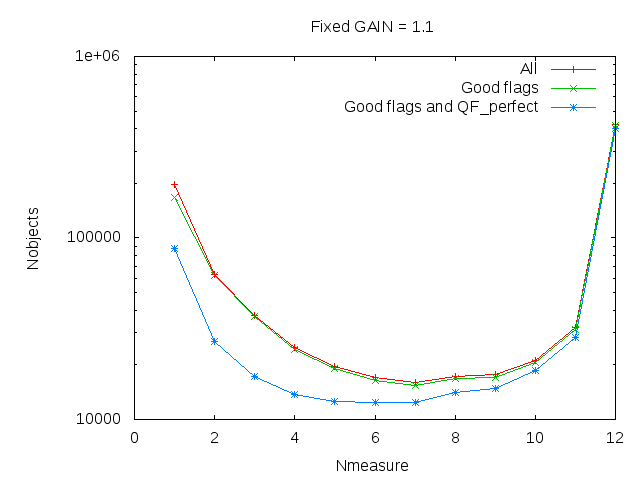
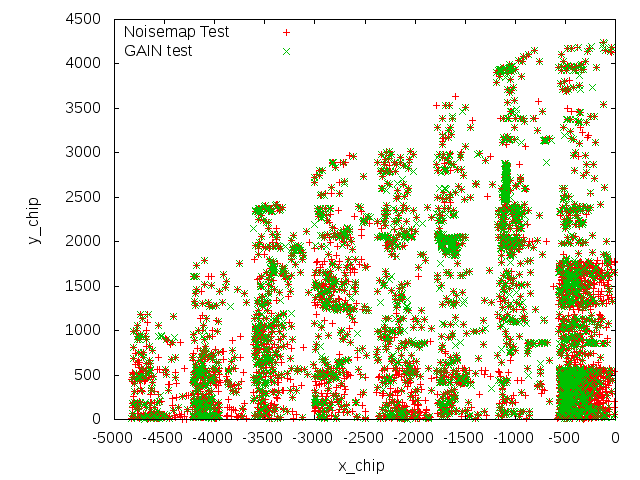
I reran the g-filter footprint, using all previous improvements with the addition of fixing the gain for every cell of the entire detector to a single value of 1.1. The same processing and analysis was done, generating a higher number of false positives than the previous (noisemap) reduction:
(Image(07_fixedgain.png,400px)
| Reduction | All N=1 | All N=12 | Good flags N=1 | Good flags N=12 | QF Perfect N=1 | QF Perfect N=12 |
| fixedgain | 196192 | 419942 | 166336 | 415331 | 87839 | 402359 |
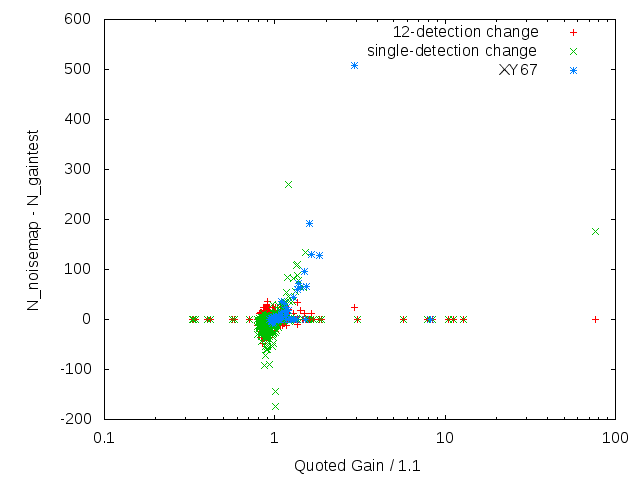
However, looking at a plot of the change in false positives for each detector cell as a function of the gain ratio (header quoted gain / chosen fixed gain of 1.1) shows that this increase is largely due to a number of detectors going from a gain less than 1.1 to this fixed gain. If we preferentially select only those cells that have quoted gains larger than 1.1, we generally see a dramatic improvement in the false detection rate, at only a minor change in the number of 12-detection measurements (red points).
(Image(fixedgain_improvement.png,400px)
This suggests that making the change to use any quoted gain below a threshold, and clipping all others at that threshold may make an improvement in the false positive rate.
| Reduction | All N=1 | All N=12 | Good flags N=1 | Good flags N=12 | QF Perfect N=1 | QF Perfect N=12 |
| Simulated gain clipped | - | - | - | - | 73591 | 397913 |
Simulating this with the noisemap/fixedgain test data gives only a negligible change. This is likely due to the fact that only 346/3840 cells have gains higher than 1.1. These cells account for 14831/76966 single detection sources in the noisemap data, and 11456 sources in the fixed gain data. Therefore, even though these cells do have an larger than average false detection rate, the total rate is not significantly improved by correcting the gains.
April 4, 2012
Dark model
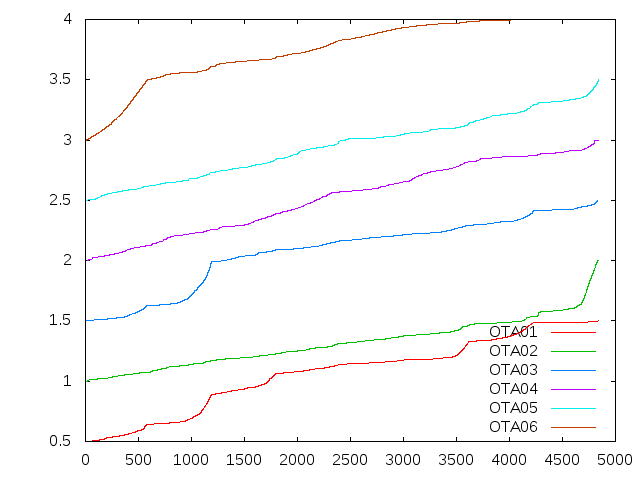
To determine the date ranges we should use the A/B mode darks, I processed OTA67 darks over the entire range of usable dates. All darks were selected to be 30s exposures that were either the 2nd or 7th of that night's sequence. I then measured the slopes in the residual image as done previously, and used this slope as the proxy to determine the dark quality and which dark is the best fit. The following plot summarizes this data, along with a set of bars indicating the current time range of various active darks.
The red points show the slopes allowing detselect to choose the current appropriate model. As we have no new models valid for data prior to 2010-01-23 (as the headers prior to that date have a different keyword for the detector temperature), these data are only fit with their default models. The large slopes and scatter in this data suggest new darks would be useful for this older data.
For data taken after 2011-05-01, the A-mode dark is the current model, and has been previously proven to match the data better than previous models. This data is included for completeness.
The intermediate period (2010-01-23 to 2011-05-01) is currently fit with det_id 845, which is the "average" dark that was constructed without knowledge of the A and B modes. This data does separate reasonably well into the two modes, with the B-mode dark minimizing the slopes for those dates that seem to be in that mode. The A-mode dark does not appear to be a significant improvement over det_id 845, making the choice of which dark to use for these dates unclear.
Before constructing any new darks, I am going to register a set of B-mode darks that have date ranges that cover only that data that is clearly in the B-mode, such that slope_B < slope_845.

Noisemap
I initially thought that the break in the detector noise values was caused by the dark model being applied, but that does not seem to be the case. Therefore, something seems to have happened to suddenly shift the noise on certain cells down relative to where they were before ~2011-05-01.

March 30, 2012
SDSS match comparison
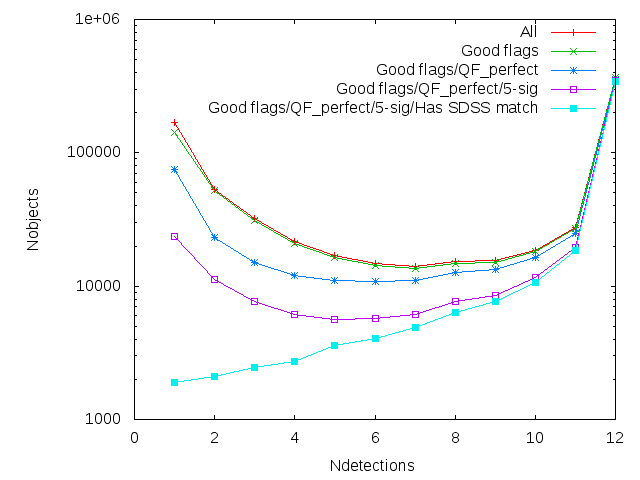
Using Nigel's SDSS catalog, I matched the noisemap results against the SDSS Stripe 82 data, and did the same detection histograms as before.

The numbers are smaller than the previous table, as Stripe 82 only extends to +/- 1.25 degrees declination.
| Reduction | All N=1 | All N=12 | Good flags N=1 | Good flags N=12 | QF Perfect N=1 | QF Perfect N=12 | SDSS Match N=1 | SDSS Match N=12 |
| noisemap | 153892 | 367454 | 126529 | 362838 | 65470 | 351742 | 10166 | 345433 |
March 27, 2012
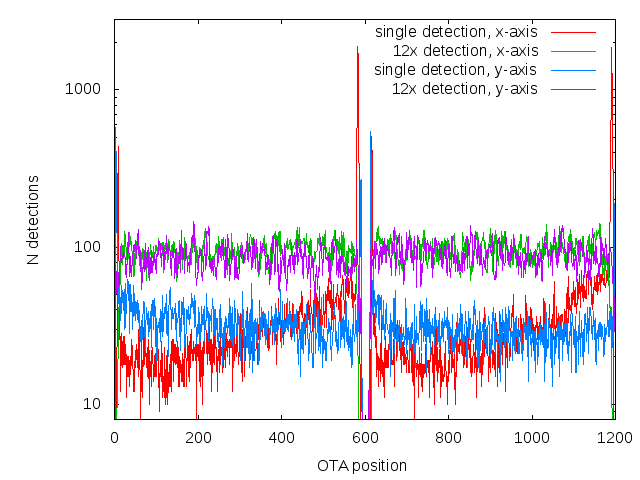
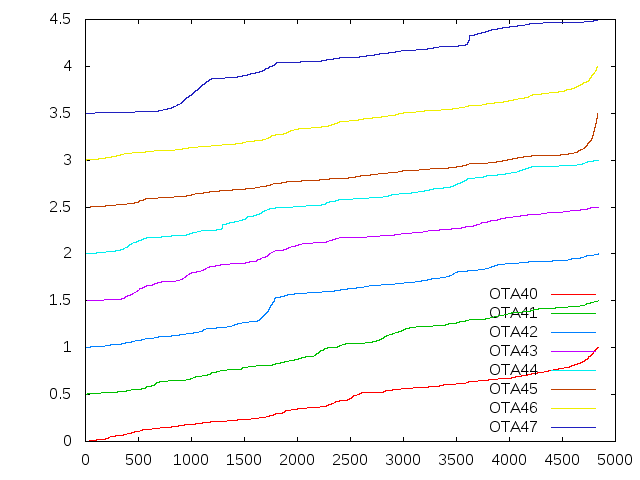
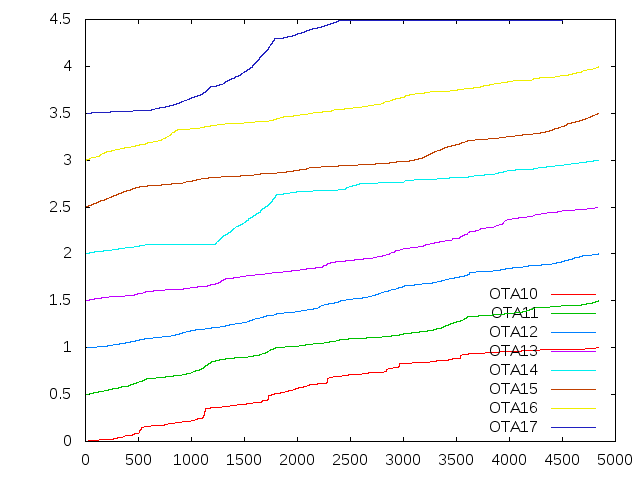
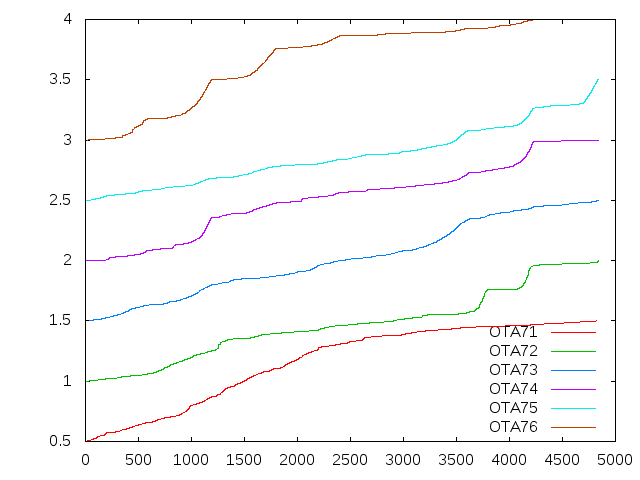
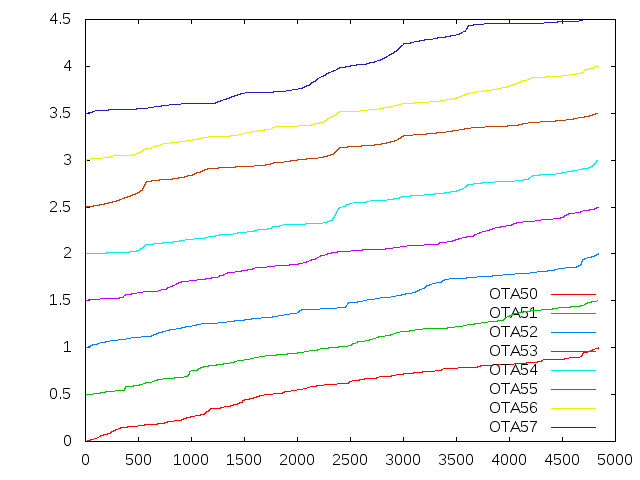
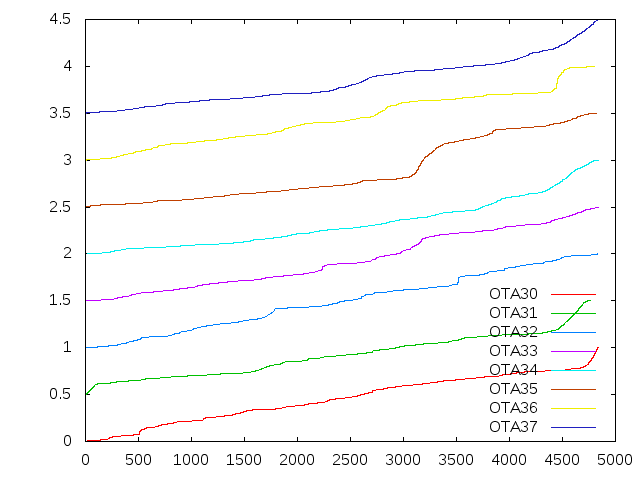
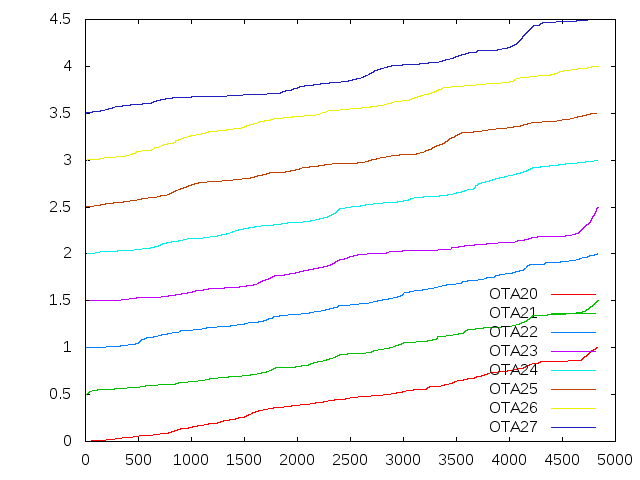
Normalized single-detection x-position CDF plots for all exposures used in the czw.footprint.noisemap test:


This still shows the ramp effect caused by position dependence in the false positives. I've checked that the noisemap was used, and it was, and an examination of the variance map shows the added variance due to the noisemap so it appears that the detrend creation and the recipes are correct.
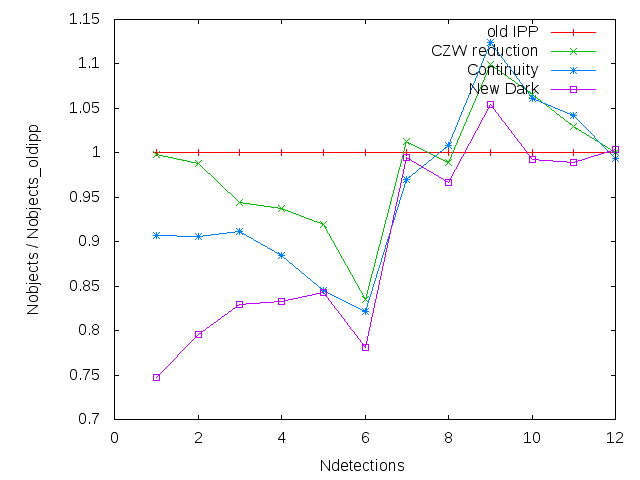
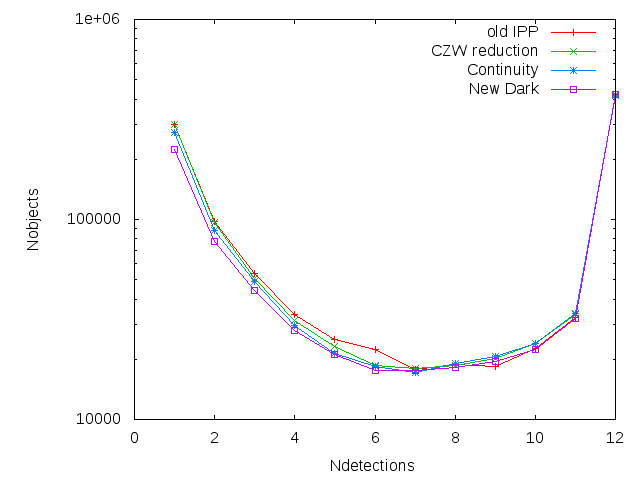
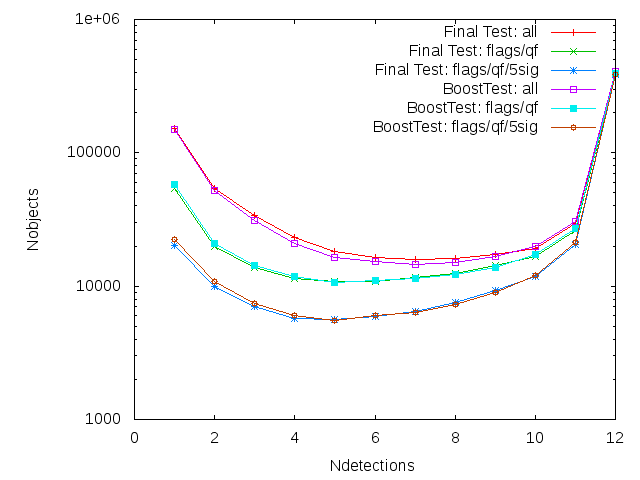
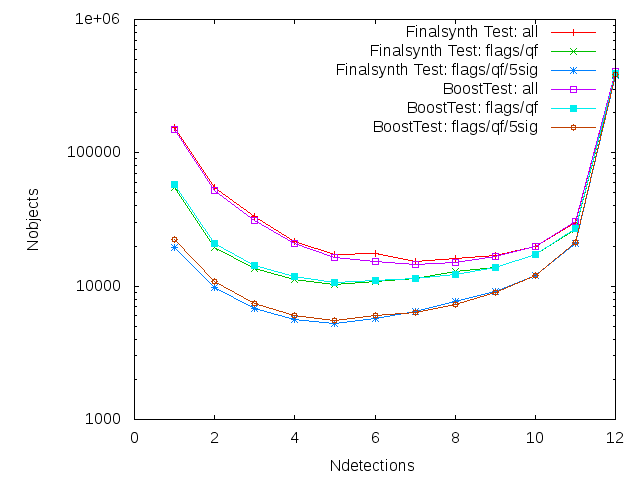
Comparing the detection histograms for the various reductions (dropping the oldipp reduction, as it appears to have different flag definitions than later reductions):


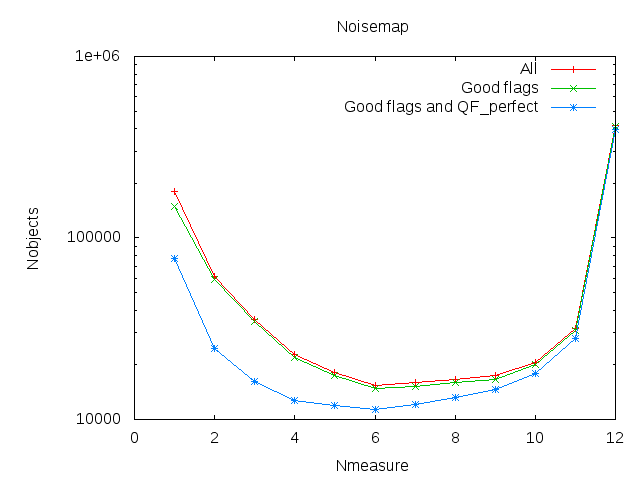
The noisemap does remove a significant number of false detections, as shown in the following table, although even with the best exclusions, there is still a ~20% contamination rate.
| Reduction | All N=1 | All N=12 | Good flags N=1 | Good flags N=12 | QF Perfect N=1 | QF Perfect N=12 |
| oldipp | 299374 | 420635 | 38 | 30 | 194169 (ignore flags) | 404422 (ignore flags) |
| czwreduction | 298849 | 420891 | 264070 | 414845 | 165624 | 401662 |
| continuity | 271480 | 417811 | 237525 | 411810 | 142463 | 398707 |
| new dark | 223680 | 422322 | 191487 | 416508 | 98467 | 403106 |
| noisemap | 180204 | 416785 | 149269 | 411294 | 76966 | 398206 |
March 22, 2012
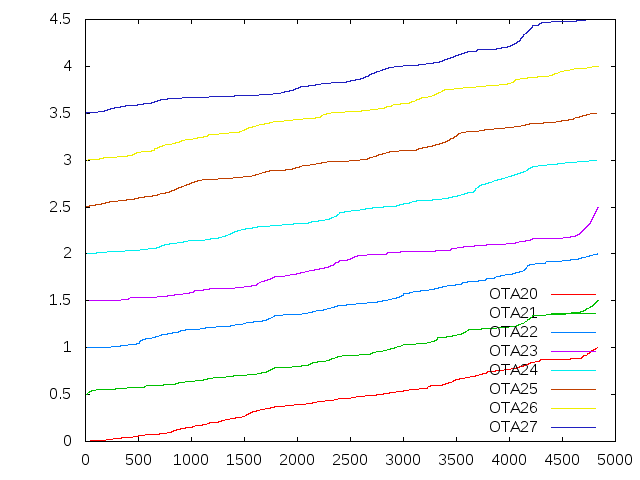
Normalized single-detection x-position CDF plots for all exposures used in the czw.footprint.dark test:


Example NOISEMAP detproc image showing the gradients in observed noise as a function of OTA/cell/position. The cells that show jumps in the above CDFs also have gradients in the image noise as shown below.

March 21, 2012
As the observed image noise does not match the noise model as stored in the variance image, a noisemap detrend is being constructed to include the correct position dependent noise. This noisemap measures the local pixel sigma on a 20x20 grid of positions across each cell. Bias frames are used for this measurement, as they do not have any sky or dark signal that would influence this measurement. This noisemap is then used in the processing of science images instead of the read noise, as the direct measurement includes any read noise that would be observed.
March 20, 2012
Variance comparison
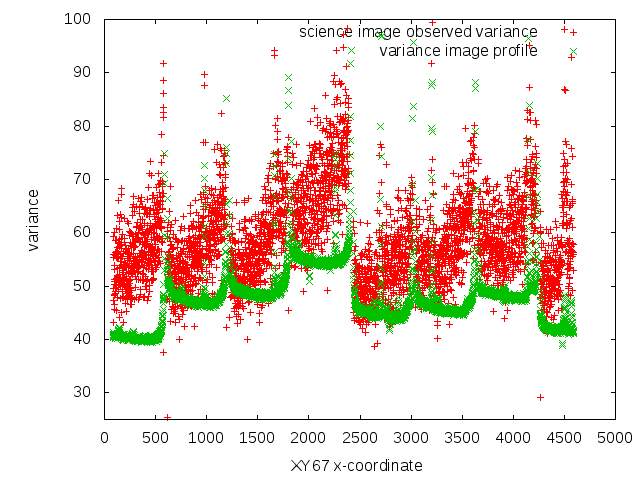
To investigate why we seem to have position dependent false positive rates, with biases to one side of the detector cells over the other (as shown below), I made profiles of the image variance in two ways. First, I calculated a mean profile of the chip stage variance image. Second, I calculated an "observed" variance profile by calculating the clipped standard deviation of the chip science image. The results are shown below:


The second image shows the ratio of the "observed" to variance image variances, along with a CDF of the singly detected objects present in the box considered for the profile as a function of x-position. It appears that we find more of these objects (which are believed to be largely false detections) in areas where the variance image underestimates the true image variance. This can be seen in an example cell from OTA67 (from which the above plots are taken): As the x-coordinate increases, the row-by-row variations increase as well, creating a higher-than expected variance.

March 19, 2012
False detection study

March 8, 2012
The new dark has finished, and although there does seem to be a weak trend in the residual slopes with dateobs, these slopes have been greatly decreased relative to the previous dark iteration:

New dark footprint results
I've reprocessed the g-filter footprint data with the new dark (including the continuity correction), and it is currently stacking (label czw.footprint.dark,data_group = czw.20120308.footprint.g). The individual frames appear to have a smoother background, and this is reflected in an improved number of orphan detections. Directly comparing to the previous footprint reductions as before:


shows that the new dark model significantly decreases the number of singly detected objects.
Footprint stack comparison
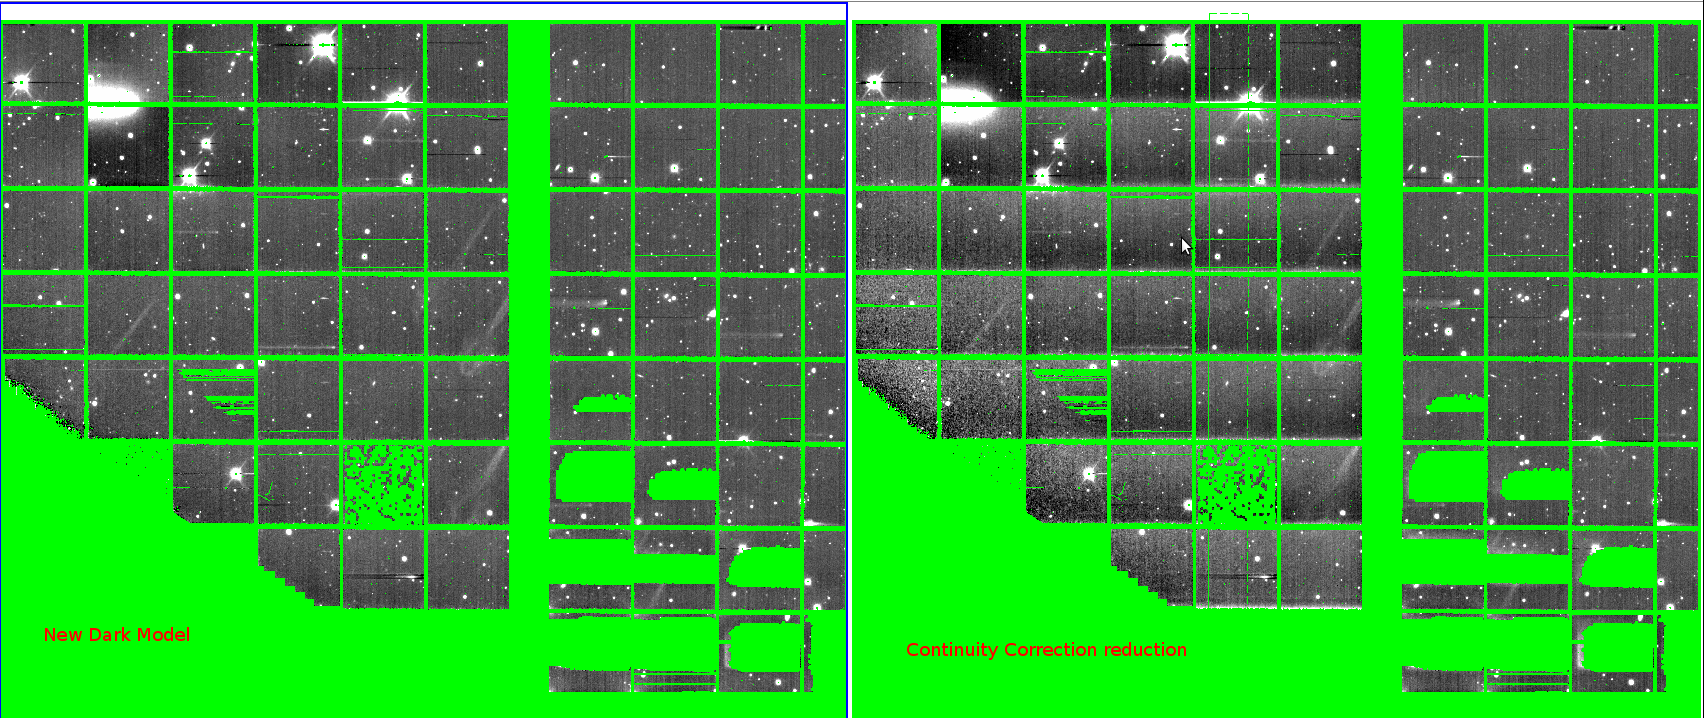
Comparing the footprint stacked images of skycell.1315.071 from the previous reduction (which enabled continuity correction) shows that the cell level gradients have largely been eliminated.

March 7, 2012
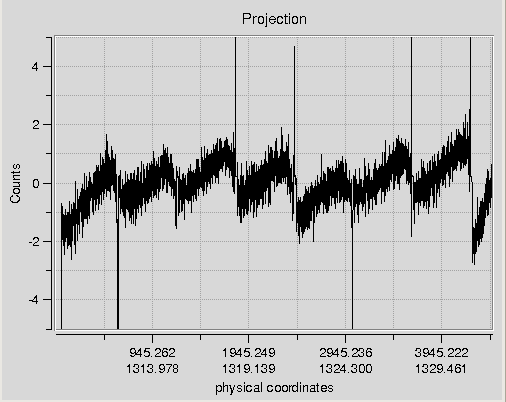
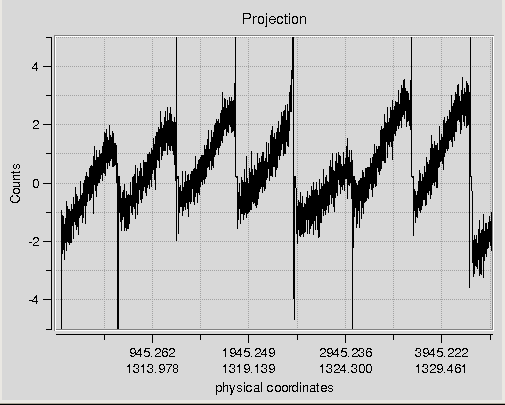
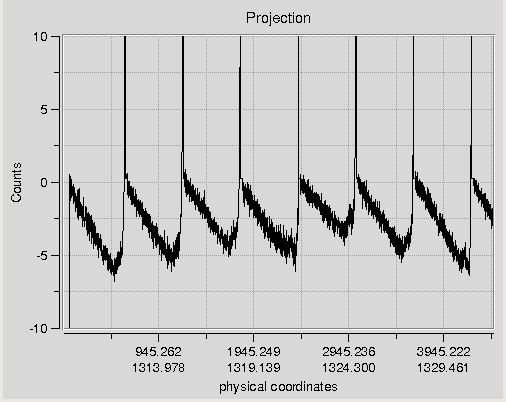
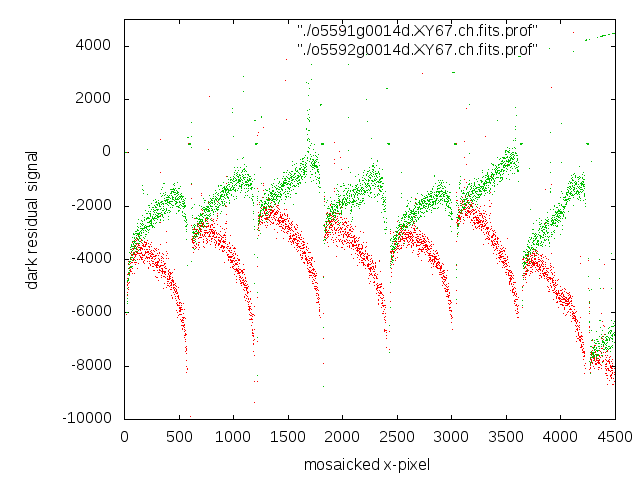
I've reduced a series of dark exposures taken since February 01 2011, as this was the time the current dark model was constructed. I've fit the slope in cell xy10 of OTA67 as a proxy measure of the dark quality, as this cell shows an introduced gradient that appears to contribute to false positives. Shown below is a profile cut across this cell and the others in that OTA and cell row (cells xy10-xy16). The code used to extract the profile does not normalize by the width, so the profile residual values and slopes plotted below need to be divided by 300 to switch to counts. The two profiles shown are from subsequent nights at the beginning of the date range considered, and show different residual patterns. Broadly, we can group nights with increasing gradients with x-pixel on a cell as Mode A, and those with decreasing gradients as Mode B.

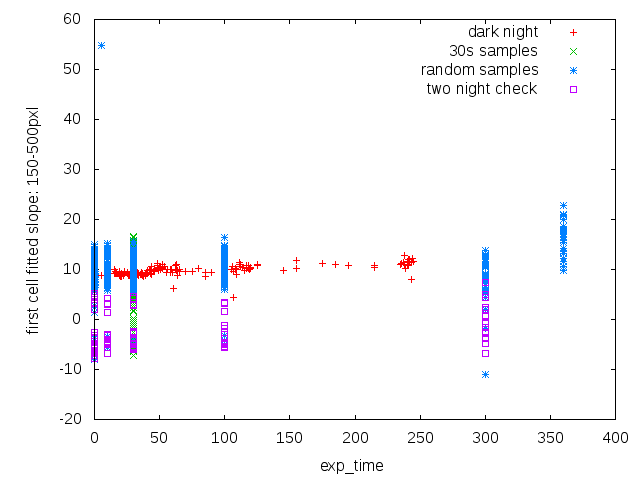
The slopes of the first cell were checked for four data samples:
- A random sampling of dark frames from the night long dark series (night of UTC 2012-03-07).
- A selection of 30s dark frames from each night, chosen from the second dark sequences of the morning and evening.
- A random sampling of all parameter space.
- All darks taken on MJD 5591 and 5592, to investigate inter-night changes.


It appears from these data that prior to about 2011-05-01, the camera (or at least OTA67) flipped between the two dark modes without any obvious pattern. The data from MJD 5591 and 5592 show that even adjacent nights can have different patterns. However, after 2011-05-01, the camera settled into what appears to be a single mode, which has persisted since.
Based on this observation, I'm currently constructing a new dark master from data taken after 2011-05-01, which should fit all exposures after this point. However, there is no clear idea why this mode has become dominant. A voltage change was done around this time to solve the STS Astrometry bug, but OTA67 was not one of those with a change.
March 5, 2012
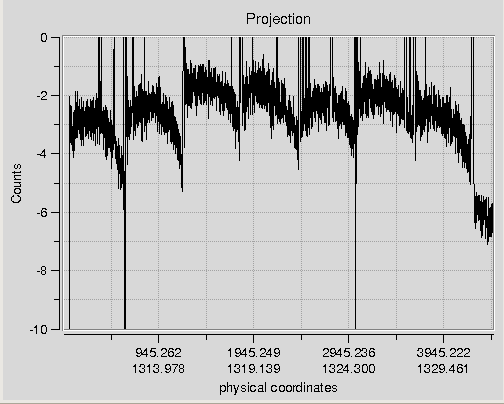
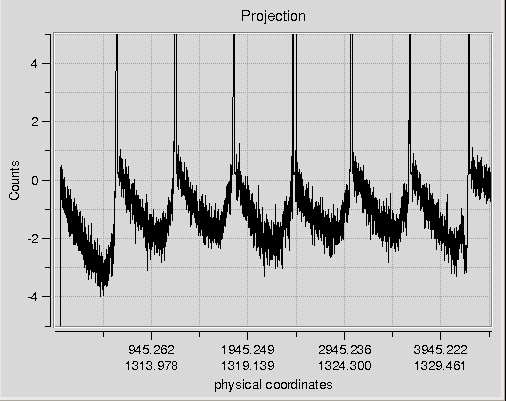
As discussed in the March 2 status, I've been looking into how the dark model may be introducing the gradients observed in the science data. To see what (if any) functional dependence these gradients had, I selected dark frames used in the construction of the current dark model, and calculated the detproc (overscan corrected, no dark applied) and detresid (overscan and current dark model applied) images. I used only XY67 in this study, as it has clear science image gradients, and was a useful test case. For each variable that could influence the dark, I selected two exposures that spanned the range, while attempting to keep the remaining variables constant. Here are the profile plots for these tests (profile the same as that used in the previous study of XY67: a large 300 pixel box covering the row of cells xy10-xy17):
dateobs
| exp_name | dateobs | exp_time | ccd_temp | detproc | detresid |
| o5605g0022d | 2011-02-13 | 10 | -78.455 |  | 
|
| o5743g0645d | 2011-07-01 | 10 | -79.6983 |  | 
|
exp_time
| exp_name | dateobs | exp_time | ccd_temp | detproc | detresid |
| o5641g0690d | 2011-03-21 | 0.001 | -87.2183 |  | 
|
| o5638g0035d | 2011-03-18 | 300 | -87.0017 |  | 
|
ccd_temp
| exp_name | dateobs | exp_time | ccd_temp | detproc | detresid |
| o5630g0494d | 2011-03-10 | 30 | -88.4883 |  | 
|
| o5736g0606d | 2011-06-24 | 30 | -77.745 |  | 
|
ccd_temp2
| exp_name | dateobs | exp_time | ccd_temp | detproc | detresid |
| o5654g0593d | 2011-04-03 | 10 | -86.765 |  | 
|
| o5612g0382d | 2011-02-20 | 10 | -72.1067 |  | 
|
30s test
| exp_name | dateobs | exp_time | ccd_temp | detproc | detresid |
| o5666g0013d | 2011-04-15 | 30 | -84.43 |  | 
|
| o5666g0645d | 2011-04-15 | 30 | -84.37 |  | 
|
Results
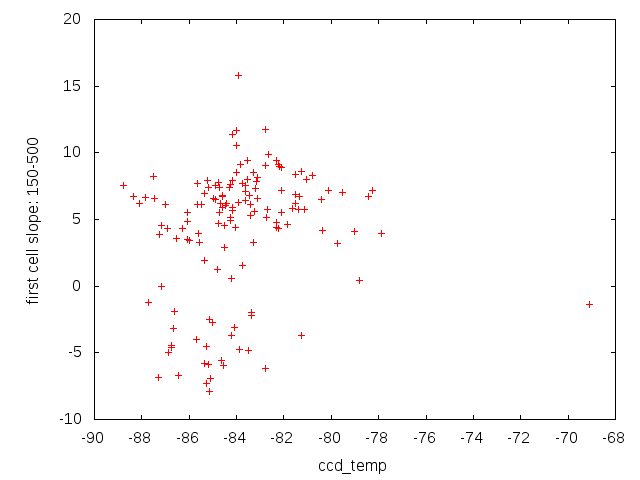
The above profiles suggested that 30s darks were somehow different than other exposure times. This seems to be an unfortunate coincidence of the darks selected. Processing a set of evening darks (of all times) from 2011-04-15 all show the downward slopes, and all from 2011-04-03 show the upward slopes. Given this behavior, I selected a set of darks from various dates, processed them, and extracted the slope in the first cell. The following plots show the results of these slopes. The exposure time was chosen to be the same for all of these exposures, and their position in the night was selected to be the same as well (these are the second 30s evening dark taken on each date between the beginning and end of the current dark model inputs).


I've requested that a sequence of darks be taken to more finely cover the range of exposure times, and will use this data to develop a more complete dark model that will hopefully not introduce any residual gradients.
Attachments (113)
- o5666g0645d_detproc.png (8.8 KB ) - added by 15 years ago.
- o5666g0645d_detresid.png (8.2 KB ) - added by 15 years ago.
- o5666g0013d_detresid.png (8.2 KB ) - added by 15 years ago.
- o5666g0013d_detproc.png (8.9 KB ) - added by 15 years ago.
- o5612g0382d_detresid.png (8.1 KB ) - added by 15 years ago.
- o5612g0382d_detproc.png (8.2 KB ) - added by 15 years ago.
- o5654g0593d_detresid.png (8.0 KB ) - added by 15 years ago.
- o5654g0593d_detproc.png (8.2 KB ) - added by 15 years ago.
- o5638g0035d_detresid.png (8.0 KB ) - added by 15 years ago.
- o5641g0690d_detresid.png (8.5 KB ) - added by 15 years ago.
- o5743g0645d_detresid.png (8.0 KB ) - added by 15 years ago.
- o5605g0022d_detresid.png (8.5 KB ) - added by 15 years ago.
- o5736g0606d_detresid.png (7.7 KB ) - added by 15 years ago.
- o5630g0494d_detresid.png (8.2 KB ) - added by 15 years ago.
- o5638g0035d_detproc.png (8.4 KB ) - added by 15 years ago.
- o5641g0690d_detproc.png (8.2 KB ) - added by 15 years ago.
- o5641g0690d_detproc.2.png (8.2 KB ) - added by 15 years ago.
- o5743g0645d_detproc.png (8.3 KB ) - added by 15 years ago.
- o5605g0022d_detproc.png (8.3 KB ) - added by 15 years ago.
- o5736g0606d_detproc.png (8.0 KB ) - added by 15 years ago.
- o5630g0494d_detproc.png (8.3 KB ) - added by 15 years ago.
- dateobs.png (5.3 KB ) - added by 15 years ago.
- pontime.png (5.2 KB ) - added by 15 years ago.
- ccdtemp.png (5.2 KB ) - added by 15 years ago.
- dateobs4.png (9.6 KB ) - added by 15 years ago.
- pontime4.png (10.5 KB ) - added by 15 years ago.
- exptime4.png (6.5 KB ) - added by 15 years ago.
- ccdtemp4.png (10.0 KB ) - added by 15 years ago.
- profiles4.png (12.4 KB ) - added by 15 years ago.
- dateobs_new_dark.png (6.5 KB ) - added by 15 years ago.
- relative_detections.png (8.3 KB ) - added by 15 years ago.
- newdark_detections.png (6.8 KB ) - added by 15 years ago.
- skycell_comparison.png (1.1 MB ) - added by 15 years ago.
- false_detection_position.png (12.0 KB ) - added by 15 years ago.
- variance_ratio.png (12.9 KB ) - added by 15 years ago.
- variance_comparison.png (18.5 KB ) - added by 15 years ago.
- variance_ratio_CDF.png (13.7 KB ) - added by 15 years ago.
- OTA67xy71.png (119.7 KB ) - added by 15 years ago.
- o5722g0021d.detproc.png (1.5 MB ) - added by 15 years ago.
- col4.png (6.1 KB ) - added by 15 years ago.
- col6.png (6.2 KB ) - added by 15 years ago.
- col5.png (6.1 KB ) - added by 15 years ago.
- col1.png (6.1 KB ) - added by 15 years ago.
- col7.png (5.6 KB ) - added by 15 years ago.
- col2.png (6.3 KB ) - added by 15 years ago.
- col3.png (6.3 KB ) - added by 15 years ago.
- col0.png (5.6 KB ) - added by 15 years ago.
- col7_noisemap.png (5.5 KB ) - added by 15 years ago.
- col5_noisemap.png (6.2 KB ) - added by 15 years ago.
- col6_noisemap.png (6.3 KB ) - added by 15 years ago.
- col4_noisemap.png (6.1 KB ) - added by 15 years ago.
- col3_noisemap.png (6.3 KB ) - added by 15 years ago.
- col2_noisemap.png (6.3 KB ) - added by 15 years ago.
- col0_noisemap.png (5.6 KB ) - added by 15 years ago.
- col1_noisemap.png (6.2 KB ) - added by 15 years ago.
- 05_noisemap.png (6.2 KB ) - added by 15 years ago.
- 04_newdark.png (6.2 KB ) - added by 15 years ago.
- 02_czwreduct.png (6.4 KB ) - added by 15 years ago.
- 03_continuity.png (6.4 KB ) - added by 15 years ago.
- 06_noisemapSDSS.png (6.8 KB ) - added by 15 years ago.
- 06_noisemapSDSS.2.png (7.0 KB ) - added by 15 years ago.
- dark_viability.png (20.1 KB ) - added by 15 years ago.
- noisemap_viability.png (27.3 KB ) - added by 15 years ago.
- 07_fixedgain.png (6.2 KB ) - added by 15 years ago.
- fixedgain_improvement.png (6.6 KB ) - added by 15 years ago.
- b_dates.dat (18.5 KB ) - added by 15 years ago.
- glycol.png (6.2 KB ) - added by 15 years ago.
- 08_5sigma_cut.png (6.9 KB ) - added by 15 years ago.
- q4.png (24.1 KB ) - added by 15 years ago.
- q7.png (6.3 KB ) - added by 15 years ago.
- col2_gaintest.png (6.2 KB ) - added by 15 years ago.
- q5.png (38.9 KB ) - added by 15 years ago.
- q8.png (7.5 KB ) - added by 15 years ago.
- new_dark_slopes.png (11.4 KB ) - added by 15 years ago.
- proposed_boosts.png (9.0 KB ) - added by 14 years ago.
- XY67_boosttest.png (26.4 KB ) - added by 14 years ago.
- boosttest.png (5.6 KB ) - added by 14 years ago.
- boostmap_fov.png (21.1 KB ) - added by 14 years ago.
- noisemap_fov.png (22.2 KB ) - added by 14 years ago.
- full_fov_comparison.png (28.0 KB ) - added by 14 years ago.
- comparison_fov_5sig.png (17.5 KB ) - added by 14 years ago.
- boostmap_fov_5sig.png (46.7 KB ) - added by 14 years ago.
- noisemap_fov_5sig.2.png (50.6 KB ) - added by 14 years ago.
- noisemap_fov_5sig.png (50.6 KB ) - added by 14 years ago.
- boostmap_synthcat_fov_5sig.png (52.6 KB ) - added by 14 years ago.
- ghost_vectors.png (16.3 KB ) - added by 14 years ago.
- ghosts_rot_selected.png (19.3 KB ) - added by 14 years ago.
- ghosts_parity_corrected.png (20.4 KB ) - added by 14 years ago.
- ghost_comparison.png (53.2 KB ) - added by 14 years ago.
- finaltest_comparison.png (7.8 KB ) - added by 14 years ago.
- ghost_comparison_synth.png (54.4 KB ) - added by 14 years ago.
- finalsynthtest_comparison.png (7.9 KB ) - added by 14 years ago.
- false_positive_star_cor.png (23.3 KB ) - added by 14 years ago.
- fp_density_concentrations.png (24.0 KB ) - added by 14 years ago.
- ghost_comparison_photsynth.png (50.7 KB ) - added by 14 years ago.
- finalsynthphottest_comparison.png (8.3 KB ) - added by 14 years ago.
- ghost_comparison_photsynth_edit.png (40.2 KB ) - added by 14 years ago.
- ghost_comparison_test21_wSDSS.png (42.9 KB ) - added by 14 years ago.
- test21_wSDSS_comparison.png (8.6 KB ) - added by 14 years ago.
- ghost_comparison_test21.png (43.4 KB ) - added by 14 years ago.
- test21_comparison.png (7.7 KB ) - added by 14 years ago.
- test120525_comparison.png (8.0 KB ) - added by 14 years ago.
- ghost_comparison_test120525.png (49.7 KB ) - added by 14 years ago.
- ghost_comparison_test29.png (46.4 KB ) - added by 14 years ago.
- test29_comparison.png (7.7 KB ) - added by 14 years ago.
- test30_comparison.png (7.7 KB ) - added by 14 years ago.
- ghost_comparison_test30.png (46.2 KB ) - added by 14 years ago.
- ghost_comparison_test32.png (77.0 KB ) - added by 14 years ago.
- test32_comparison.png (7.5 KB ) - added by 14 years ago.
- ghost_comparison_test33.png (77.6 KB ) - added by 14 years ago.
- test33_comparison.png (7.5 KB ) - added by 14 years ago.
- ghost_comparison_test34.png (78.0 KB ) - added by 14 years ago.
- test34_comparison.png (7.5 KB ) - added by 14 years ago.