| Version 11 (modified by , 11 years ago) ( diff ) |
|---|
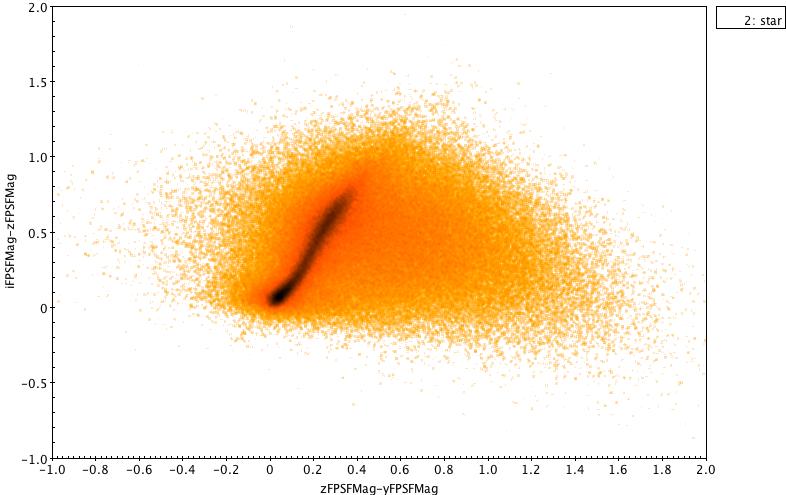
Color Color diagrams from SAS 39 data
Ken suggested that I look at the full force mean psf magnitude measurments by making color color diagrams. I thought it might be useful to compare these to the stack photometry so I did plots from those data as well.
In the following notes I describe what I did and show the resulting diagrams.
Forced Photometry
IPP psps forced photometry takes the positions of the detections made in the stack photometry and does forced photometry on the single frame warp images. These results are injested into DVO and an averaging si done there.
I decided to use the "view" ForcedMeanObjectView which is a join of the tables ObjectThin and ForcedMeanObject.
select ForcedMeanObjectView.*, (ForcedMeanObjectView.qualityFlag & 1) as extended
INTO mydb.[forced_1406] from ForcedMeanObjectView
where projectionID = 1406 and (ForcedMeanObjectView.qualityFlag) & 16 = 16
I decided to cut on the qualityFlag requiring that the "good stack" bit be set (see table ObjectQualityFlags for the bit detinitions) indicating that something (DVO ?) decided that we had good stack measurements. In order to keep they query time and size of the results table managable I queried a subset of the survey using the projectionID column. This restricted the results to objects in projection cell 1406 (334 < ra < 338 0 < dec < 4)
This yielded 562,311 objects.
The ForcedMeanObjectView only has fluxes. Since this was my first set of queries with the new schema, I decided to not convert the fluxes to magnitudes in the query. I simply grabbed the objects and ran the results through various iterations of a STILTS program to convert to magnitudes.at I used this perl script to facitiate the conversions. Adding entries like
8.9-2.5*log10(gFPSFFlux) AS gFPSFMag
to the list of columns in the query would allow us to avoid the STILTS step. However the database is going to be busy and keeping the math done there to a minimum seems like a polite thing to do. (8.9 is used as the zero point since fluxes are in Janskys).
Star / Galaxy Separation
I looked at the star galaxy separation discussion and consulted with experts and it was suggested that I use something simple. KronMag - PSFMag > 0 ==> star otherwise galaxy. Here is a  distribution from the
forced measurments.
distribution from the
forced measurments.
Attachments (13)
-
iKron-iPSF.jpg
(18.5 KB
) - added by 11 years ago.
SAS 39 Projection Cell 1406 Forced Photometry iFKronMag - iFPSFMag
- g-r_v_r-i.jpg (63.6 KB ) - added by 11 years ago.
- r-i_v_i-z.jpg (45.3 KB ) - added by 11 years ago.
- i-z_v_z-y.jpg (46.0 KB ) - added by 11 years ago.
- gal_r-i_v_i-z.jpg (46.0 KB ) - added by 11 years ago.
- gal_i-z_v_z-y.jpg (48.6 KB ) - added by 11 years ago.
- gal_g-r_v_r-i.jpg (60.1 KB ) - added by 11 years ago.
- stk_g-r_v_r-i.jpg (44.1 KB ) - added by 11 years ago.
- stk_r-i_v_i-z.jpg (32.9 KB ) - added by 11 years ago.
- stk_i-z_v_z-y.jpg (31.1 KB ) - added by 11 years ago.
- stk_gal_g-r_v_r-i.jpg (51.6 KB ) - added by 11 years ago.
- stk_gal_i-z_v_z-y.jpg (42.5 KB ) - added by 11 years ago.
- stk_gal_r-i_v_i-z.jpg (39.1 KB ) - added by 11 years ago.
Download all attachments as: .zip