| Version 5 (modified by , 16 years ago) ( diff ) |
|---|
Chip Stage Timing
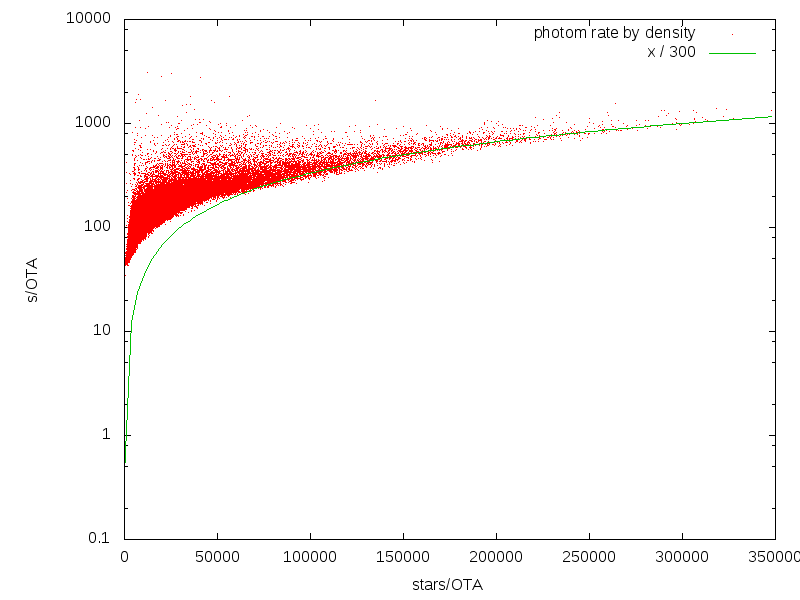
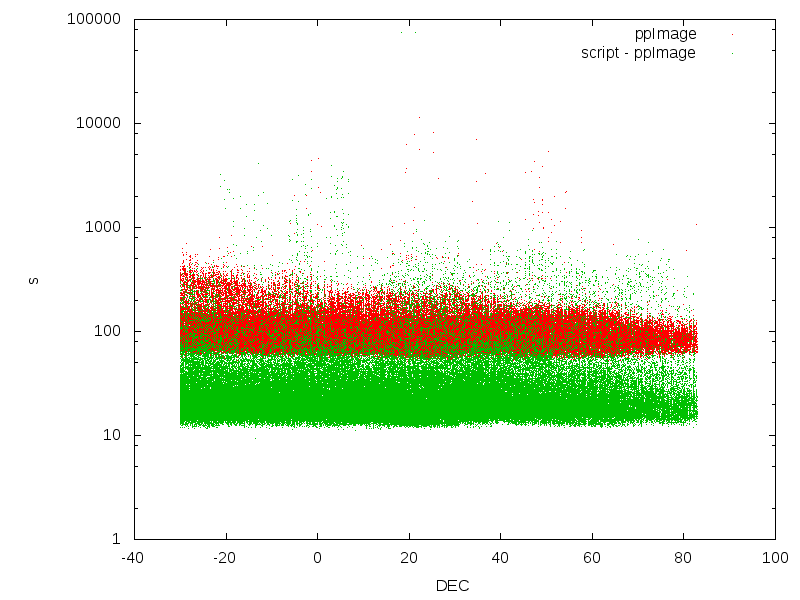
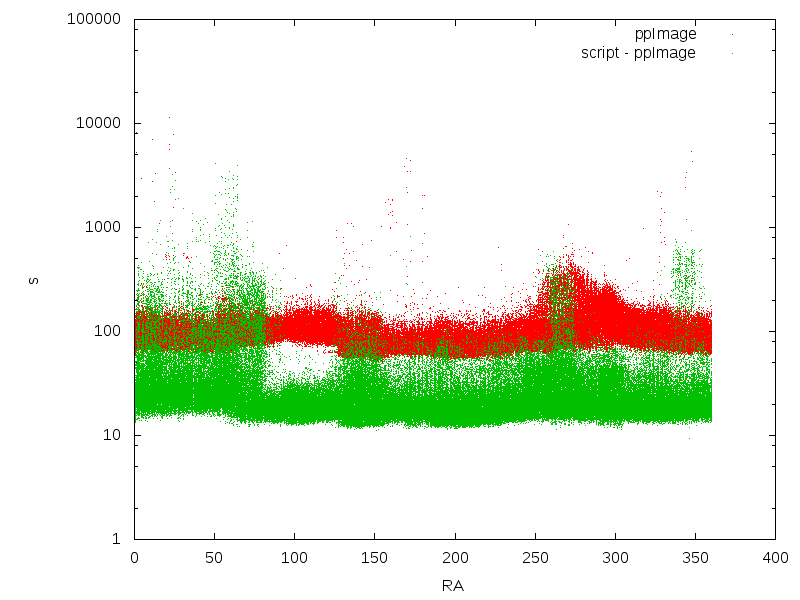
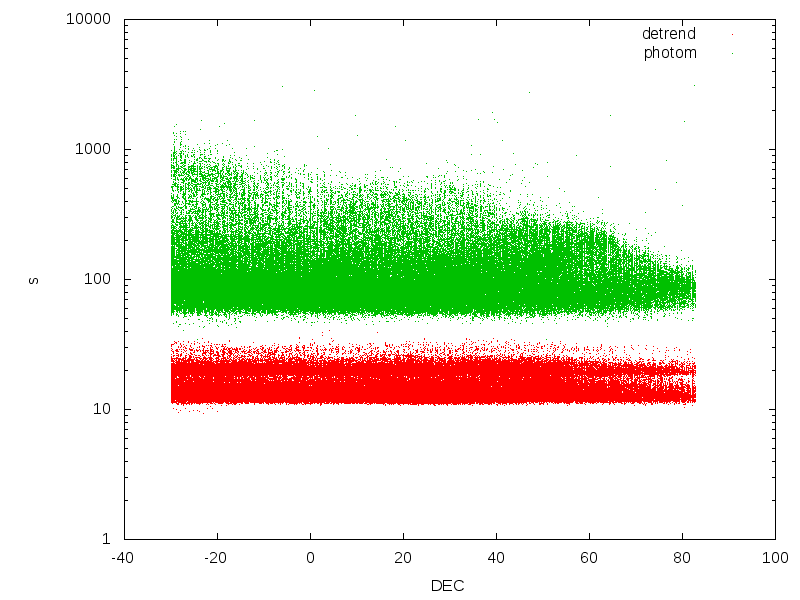
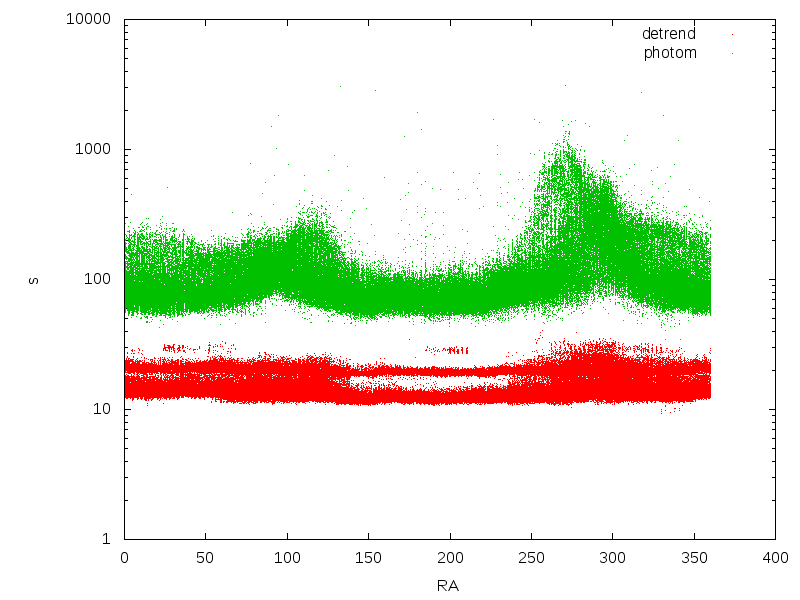
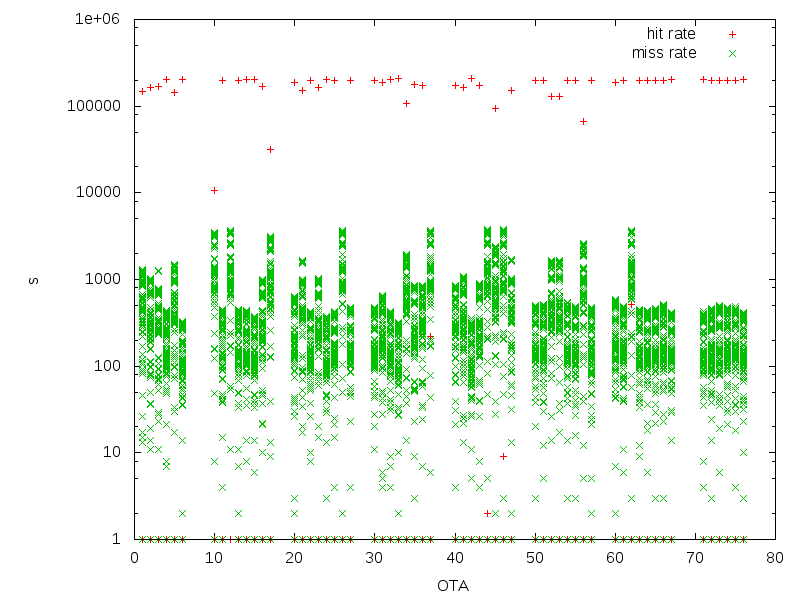
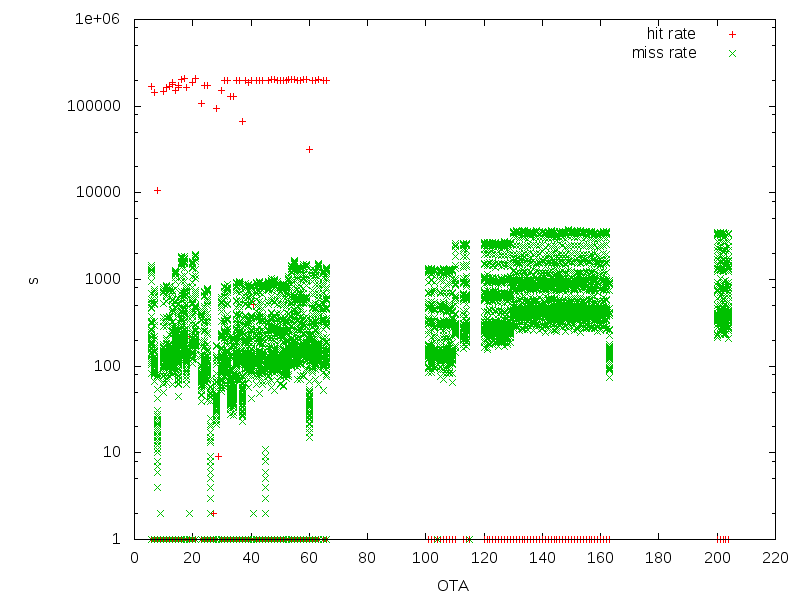
The majority of the processing time at chip stage is consumed by the photometry process (median dtime_photom = 0.64 * dtime_script). Most chips have a similar distribution of dtime_photom values, with medians less than 100 seconds. Ten of the chips show a different distribution, with median dtime_photom values larger than 100s and a large day-to-day variation in distribution shape. The plots below show selected chips, with the entire set of plots attached in pdf format.
The CDF plots show the distribution of dtime_photom values for each chip, separated by the date they were observed. Each curve is labeled with the median, non-parametric dispersion, minimum and maximum dtime_photom.
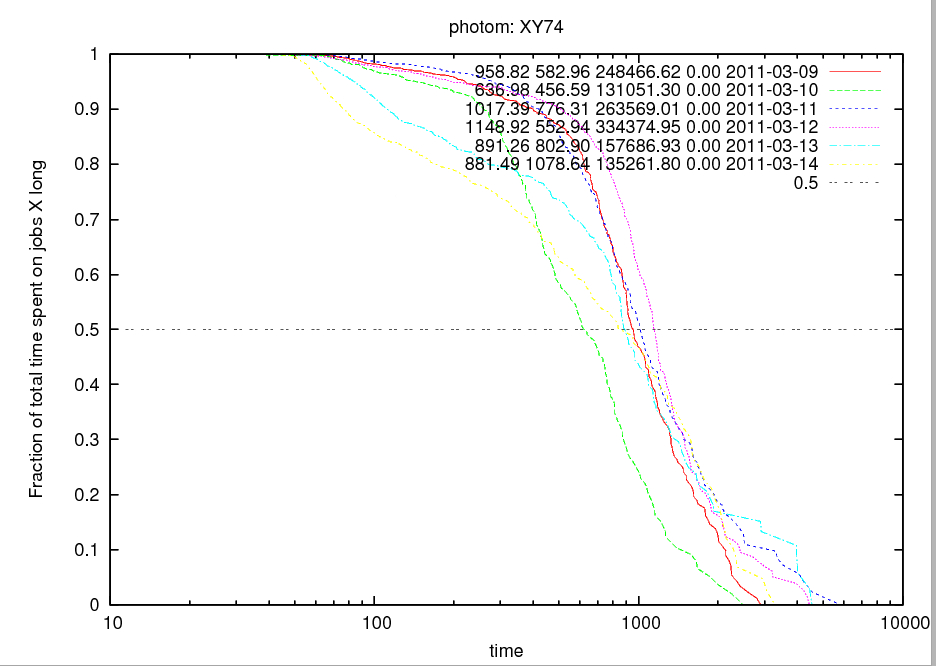
The second set of plots show for each date the fraction of total dtime_photom spent on jobs with dtime larger than the value on the x-axis. These curves are labeled with the median value (half of the time is spent on jobs with photometry times longer than this value), non-parametric sigma, and the sum of dtime_photom for this date/chip pair. This plot is somewhat skewed by a small number of points, but does show that even on good chips, the ~10% of jobs that run longer than 100s consume ~30% of the total photometry time.
The set of chips that can be considered "bad" (XY04, XY05, XY16, XY27, XY35, XY60, XY64, XY72, XY74, XY75) seem to share the same distribution of n_stars, fwhm, and sky background as the good chips. The photometry time does not correlate with any of these values, either.
| Good chip | Bad chip | |
| CDF of dtime_photom values |  | 
|
| Fraction of time spent running photometry |  | 
|
Darks
Re-processing a few chips using both the standard dark and the new dark shows a significant improvement in the speed of ppImage. The following table summarizes two chips:
| exp_name | chip | dark used | t_ppImage | t_footprints | N_peaks | N_final_footprints |
| o5632g0062o | OTA75 | OLD | 453.52030 | 341.473507 | 5867 | 1978 |
| o5632g0062o | OTA75 | NEW | 99.933317 | 2.430781 | 2293 | 1654 |
| o5632g0516o | OTA05 | OLD | 276.17127 | 170.655817 | 4253 | 2191 |
| o5632g0516o | OTA05 | NEW | 114.50915 | 12.590614 | 2583 | 2054 |
This shows that the difference in time between the new and old darks is almost entirely due to the footprint culling process. The final number of footprints is similar between the two runs, but the new dark cuts down the number of initial peaks, so there are fewer footprints to cull.
Attachments (15)
- photom_cdf.pdf (719.1 KB ) - added by 16 years ago.
- photom_excesstime.pdf (713.6 KB ) - added by 16 years ago.
- xy67_cdf.png (32.6 KB ) - added by 16 years ago.
- xy74_cdf.png (37.1 KB ) - added by 16 years ago.
- xy74_excess.png (40.2 KB ) - added by 16 years ago.
- xy67_excess.png (37.9 KB ) - added by 16 years ago.
- phot_by_N.png (9.1 KB ) - added by 13 years ago.
- total_script_DEC.png (18.8 KB ) - added by 13 years ago.
- total_script_RA.png (18.0 KB ) - added by 13 years ago.
- detrend_phot_DEC.png (16.6 KB ) - added by 13 years ago.
- detrend_phot_RA.png (15.4 KB ) - added by 13 years ago.
- by_ota.png (9.2 KB ) - added by 13 years ago.
- by_host.png (10.7 KB ) - added by 13 years ago.
- targeting_by_ota.png (17.1 KB ) - added by 13 years ago.
- targeting_by_host.png (14.1 KB ) - added by 13 years ago.
Download all attachments as: .zip