| Version 25 (modified by , 16 years ago) ( diff ) |
|---|
Introduction
Czartool is a collection of Perl scripts designed to assist when monitoring the IPP system. Czartool began as a simple script to quickly display the current status of each label in the system, i.e. how many images pending, how many faults. A webpage followed on ippMonitor, then a database was implemented in combination with a polling program (czarpoll) which updates the database every few minutes with the current status of the IPP.
User notes
Most users will use czartool via the web page in ippMonitor. This gives a snapshot of processing at the current time, with plots starting from around 6:30am in the morning, since this is when (currently) burntool is scheduled to begin processing the previous night's data.
There are, however, other useful Perl scripts available in trunk/tools that enable the user to go back further in time and create plots or metrics of particular labels, stages or date ranges. The main tool of interest is czarplot.
czarplot
Czarplot may be used to plot the contents of the czar database, which holds a history of IPP processing dating back to around mid-July 2010.
- all plots (where relevant) can be given a date range, but will default to today from 6:30 if not is provided. Note that all times are in HST. When necessary (i.e. when querying rawExp in gpc1, HST is converted to UTC internally).
- date ranges can be given with
-b <beginTime>and-e <endTime>flags or-y <date>for a single day
- where relevant a stage can be chosen, else defaulting to 'all stages'
- were relevant a label can be chosen, else defaulting to 'all_stdscience_labels'
The available plots are as follows:
Processing time-series
This either plots the the number of processed exposures for all stages (burntool, chip, cam etc) eg
./czarplot.pl -y 2010-11-22

or the number of processed, pending and faults for one stage, eg
./czarplot.pl -y 2010-11-22 -s warp

Processing histograms
Using the -h argument, stacked histograms showing processed/pending/faults can be generated. For example:
./czarplot.pl -b 2010-10-20 -e '2010-10-20 11' -h

Rate plots
It is possible, using the -r argument, to create histograms of exposures-processed-per-some-interval (the interval can be specified with the -i argument, eg -i 1 HOUR) otherwise a 'sensible' interval will be chosen for you.
./czarplot.pl -y 2010-11-09 -r

Magic mask fraction
Both a histogram and cumulative distribution of the magic mask fraction can be plotted for a data range. Warning these plots can take some time to complete due to multiple JOINS necessary in the query to the gpc1 database.
./czarplot.pl -y 2010-08-15 -m


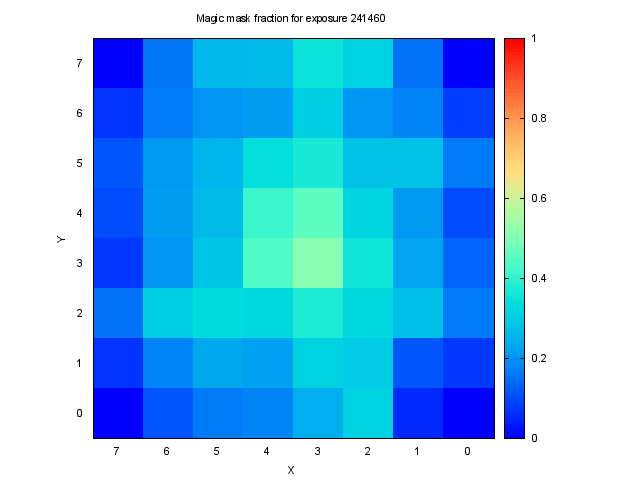
It is also possible to view the magic mask for a particular exposure as a color gradient.
./czarplot.pl -m -x 241460

Metrics
Since czartool has a database containing a history of IPP processing since July, it is therefore useful for deriving metrics.
Developer Notes
Attachments (11)
- czarplot_single_exp_magic_mask_fraction.png (4.6 KB ) - added by 16 years ago.
- czarplot_magic_mask_fraction_h.png (5.4 KB ) - added by 16 years ago.
- czarplot_magic_mask_fraction_d.png (6.0 KB ) - added by 16 years ago.
- czarplot_cluster.png (7.0 KB ) - added by 16 years ago.
- czarplot_hosts_space.png (6.0 KB ) - added by 16 years ago.
- czarplot_linear_all_stdscience_labels_all_stages_d.png (11.5 KB ) - added by 16 years ago.
- czarplot_linear_all_stdscience_labels_all_stages_t.png (9.5 KB ) - added by 16 years ago.
- czarplot_linear_all_stdscience_labels_all_stages_r.png (6.4 KB ) - added by 16 years ago.
- czarplot_linear_all_stdscience_labels_magic_t.png (6.3 KB ) - added by 16 years ago.
- czarplot_linear_all_stdscience_labels_all_stages_h.png (5.7 KB ) - added by 16 years ago.
- czarplot_linear_all_stdscience_labels_chip_d.png (8.4 KB ) - added by 16 years ago.
Download all attachments as: .zip