| Version 77 (modified by , 15 years ago) ( diff ) |
|---|
Introduction
Czartool is a collection of Perl scripts and modules designed to assist when monitoring the IPP system. Czartool began as a simple script to quickly display the current status of each label in the system, i.e. how many images pending, how many faults. A webpage followed on ippMonitor, then a database was implemented in combination with a polling program (czarpoll) which updates the database every few minutes with the current status of the IPP.
User notes
Most users will use czartool via the web page in ippMonitor. This gives a snapshot of processing at the current time, with plots starting from around 6pm, just before nightly observations begin and burntool is scheduled to begin processing the data. There are, however, other useful Perl scripts available in trunk/ippMonitor/czartool that enable the user to go back further in time and create plots or metrics of particular labels, stages or date ranges. The main tool of interest is czarplot.
Czarplot
NOTE The version of gnuplot necessary for czarplot to be able to save plots to file as pngs is only installed on ipp004 and ipp009.
czarplot may be used to plot the contents of the czar database, which holds a history of IPP processing dating back to around mid-July 2010.
- all plots (where relevant) can be given a date range. Note that all times are in HST. When necessary (i.e. when querying rawExp in gpc1, HST is converted to UTC internally).
- if no time is given,
czarplotwill default to plot from a start time provided in the config file, which is currently 18:00.
- date ranges can be given with
-b <beginTime>and-e <endTime>flags or-d <date>for a single day or with-p <interval>for a period in the past to present
- where relevant a stage can be chosen, else defaulting to 'all stages'
- were relevant a label can be chosen, else defaulting to 'all_stdscience_labels'
The available plots are as follows.
Processing time-series and histograms
Using the -t argument (or none, since this is the default plot-type), czarplot can create time-series plots of either all stages (burntool, chip, cam etc), or one particular stage. For the latter, the number of processed, pending and faults are all shown. Using the -h argument, stacked histograms showing processed/pending/faults can be generated. Examples:
./czarplot.pl -d 2010-11-22
./czarplot.pl -d 2010-11-22 -s magic
./czarplot.pl -d 2010-11-22 -h


Rate and 1st-derivative plots
It is possible, using the -r argument, to create histograms of exposures-processed-per-some-interval (the interval can be specified with the -i argument, eg -i 1 HOUR) otherwise a 'sensible' interval will be chosen for you. You can also generate first-derivative plots, using the -f argument
./czarplot.pl -d 2010-10-18 -r
./czarplot.pl -d 2010-10-18 -f
./czarplot.pl -d 2010-10-18 -f -s chip


Magic-mask fraction
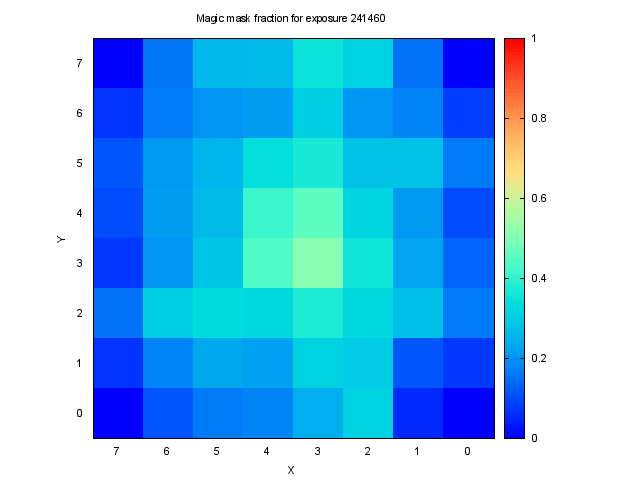
Both a histogram and cumulative distribution of the magic mask fraction can be plotted for a data range. Warning these plots can take some time to complete due to multiple JOINS necessary in the query to the gpc1 database. It is also possible to view the magic mask for a particular exposure as a color gradient. All three are shown here.
./czarplot.pl -d 2010-08-15 -m
./czarplot.pl -m -x 241460


Nebulous plots
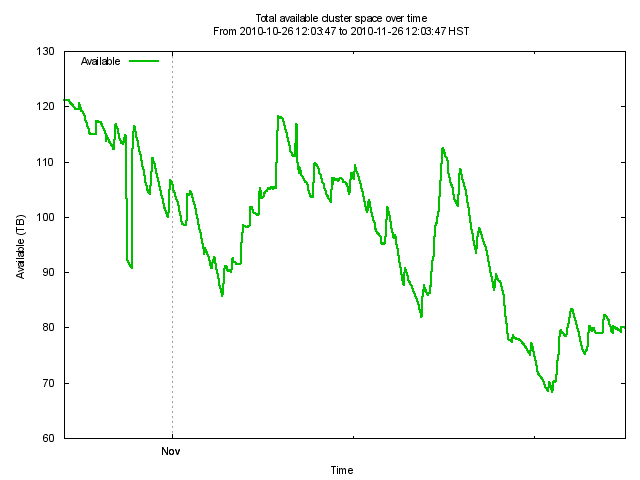
There are two Nebulous plots, one showing a snapshot of current cluster space, the other a time-series of available cluster space over time. Both require the -n argument, the latter with an additional -t denoting 'time-series' Example:
./czarplot.pl -n
./czarplot.pl -n -t -p '1 month'


Metrics
Since czartool maintains a database containing a history of IPP processing since July, it is therefore useful for producing metrics.
The czarmetrics script can be used to generate metrics in the form of HTML web pages for one day, a range of days, or cumulatively for a range of dates (eg a lunation). These pages consist mainly of the plots above, and are currently located here.
To produce metrics for a single day, run like this
./czarmetrics.pl -d 2011-01-12
or for a range of days (eg a lunation), like this (where the 'c' flag means cumulative)
./czarmetrics.pl -c -b 2010-12-22 -e 2011-01-19
Analysis
Simple analysis can be performed for a given stage, providing start and finish times as well as reporting whether that stage is currently 'stuck' (i.e. there are pending images, but processing is not proceeding). For example
./czarplot.pl -d 2010-10-16 -f -s chip -a
+---------------+---------------------+---------------------+------------+-----------+---------+-------+--------+--------+
|     stage     |       started       |       finished      | time taken | processed | pending |  rate | faults | stuck? |
+---------------+---------------------+---------------------+------------+-----------+---------+-------+--------+--------+
|       chip    |  2010-10-16 07:30:25|  2010-10-16 19:33:24|   12:02:59 |   330     |     0   | 27.39 |     0  |   no   |
+---------------+---------------------+---------------------+------------+-----------+---------+-------+--------+--------+
Roboczar
roboczar is a process that runs in the background monitoring the czartool database. It utilizes the above analysis functionality to report whether a particular stage of processing has stuck, or if an important pantasks_server has stopped or crashed. It communicates by sending warning emails to the ps-ipp-ops mailing list.
Developer Notes
Czartool is written in Object Perl using a MySQL database. The code currently lives in trunk/tools. Scripts, such as czarplot, are in this base directory whereas classes are in the czartool folder. The XML config file currently resides in the same folder, as is called czarconfig.xml.
Czarpoll
czarpoll is the background process that collects all the data required for czartool to work. It can be run with no arguments, as it gets configuration information from the config file. Instructions to run czarpoll can be found on the czar processing documentation page, here.
Czartool database
The czartool database, called czardb, is hosted on ippdb01. It can be accessed as ipp user with the usual password.
Maintenance
To curb the growth of the database, each night at midnight, czarpoll goes back to the previous day and trims the contents of all tables. For the current day, 'readings' are taken by czarpoll every few minutes. After trimming, there exists one reading per 30 minutes in all tables (this is configurable, and may need to be reduced to hourly at some point).
All database tables are also optimized at this time, since heavy deletion like that described above can cause fragmentation and, consequently, performance issues.
Attachments (11)
- czarplot_single_exp_magic_mask_fraction.png (4.6 KB ) - added by 16 years ago.
- czarplot_magic_mask_fraction_h.png (5.4 KB ) - added by 16 years ago.
- czarplot_magic_mask_fraction_d.png (6.0 KB ) - added by 16 years ago.
- czarplot_cluster.png (7.0 KB ) - added by 16 years ago.
- czarplot_hosts_space.png (6.0 KB ) - added by 16 years ago.
- czarplot_linear_all_stdscience_labels_all_stages_d.png (11.5 KB ) - added by 16 years ago.
- czarplot_linear_all_stdscience_labels_all_stages_t.png (9.5 KB ) - added by 16 years ago.
- czarplot_linear_all_stdscience_labels_all_stages_r.png (6.4 KB ) - added by 16 years ago.
- czarplot_linear_all_stdscience_labels_magic_t.png (6.3 KB ) - added by 16 years ago.
- czarplot_linear_all_stdscience_labels_all_stages_h.png (5.7 KB ) - added by 16 years ago.
- czarplot_linear_all_stdscience_labels_chip_d.png (8.4 KB ) - added by 16 years ago.
Download all attachments as: .zip