| Version 4 (modified by , 16 years ago) ( diff ) |
|---|
This page investigates why the fringe coefficients are bad, which was first described here : FringeInvestigations2011
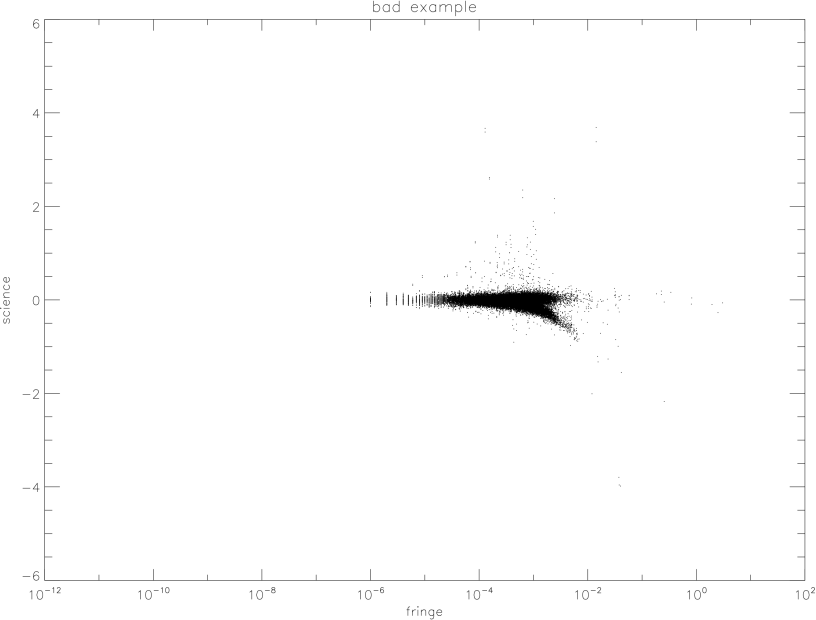
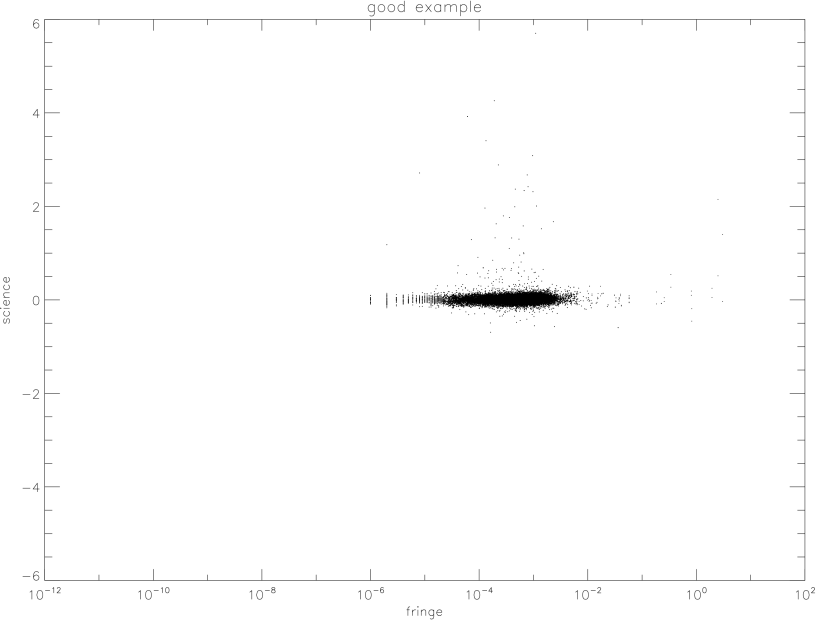
The GOOD cell example: o5568g0093o.ota06.fits The BAD cell example: o5568g0104o.ota06.fits
To investigate, it is necessary to run ppImage by hand. I used these parameters:
ppImage -file neb://ipp042.0/gpc1/20110107/o5568g0093o/o5568g0093o.ota06.fits -recipe PPIMAGE CHIP -recipe PSPHOT CHIP -recipe PPSTATS CHIPSTATS -stats stats -dbname gpc1 test.fringe.0093.r28950 -trace psModules.detrend 10  >& test.fringe.0093.r28950.txt
ppImage -file neb://ipp042.0/gpc1/20110107/o5568g0104o/o5568g0104o.ota06.fits -recipe PPIMAGE CHIP -recipe PSPHOT CHIP -recipe PPSTATS CHIPSTATS -stats stats -dbname gpc1 test.fringe.0104.r28950 -trace psModules.detrend 10 > & test.fringe.0104.r28950.txt
This generates output files with extra debugging information. There are lines that look like this in the output:
       F -0.000677 -0.051783 0.492753 0
       F -0.000677 -0.052536 0.593636 0
       F -0.000677 -0.059012 0.491503 0
       F -0.000677 -0.108347 0.379989 0
from pmFringeStats.c, we see that the F # # # # comes from here:
psTrace("psModules.detrend", 7, "F %f %f %f %d\n",
                    fringe->f->data.F32[j], science->f->data.F32[j],
                    1 / science->df->data.F32[j],(int) mask->data.PS_TYPE_VECTOR_MASK_DATA[j]);
so it is:
F (fringe) (science) (science_err) (mask?)
I grabbed all the F lines, and plotted fringe vs science for the good and the bad cell.


I've included .gz files containing the fringe data. The columns (and an example) are shown below.
| F | fringe | science | science err | mask? | [xmin:xmax, ymin:ymax] | cell |
| F | -0.000331 | -0.033280 | 0.502123 | 0 | [351:362,545:556] | xy15 |
Attachments (4)
- fringeplots-1.png (21.3 KB ) - added by 16 years ago.
- fringeplots-0.png (19.1 KB ) - added by 16 years ago.
- fringe.0093.r28950.txt.gz (1.8 MB ) - added by 16 years ago.
- fringe.0104.r28950.txt.gz (1.8 MB ) - added by 16 years ago.
Note:
See TracWiki
for help on using the wiki.