| Version 2 (modified by , 17 years ago) ( diff ) |
|---|
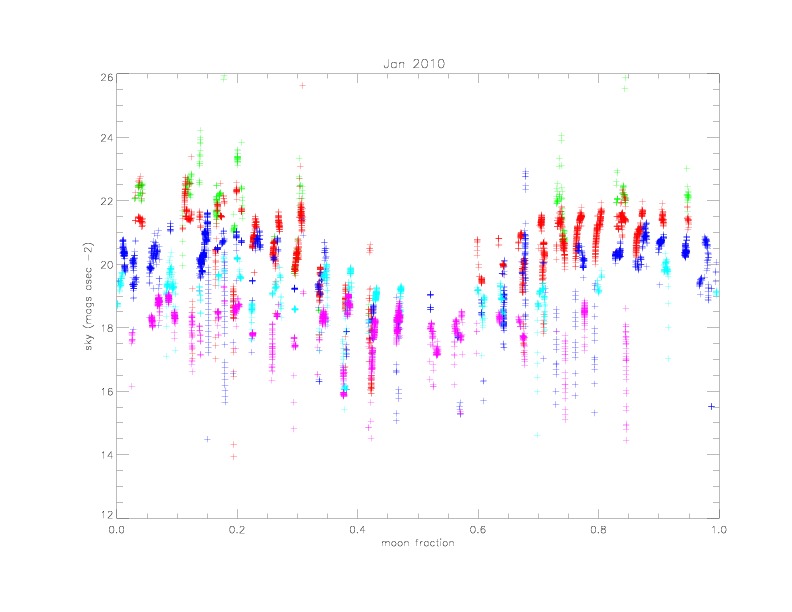
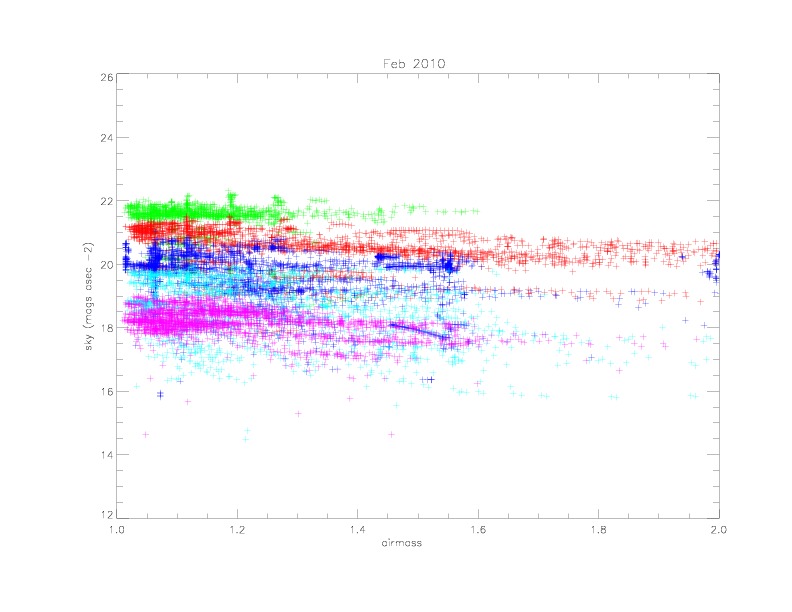
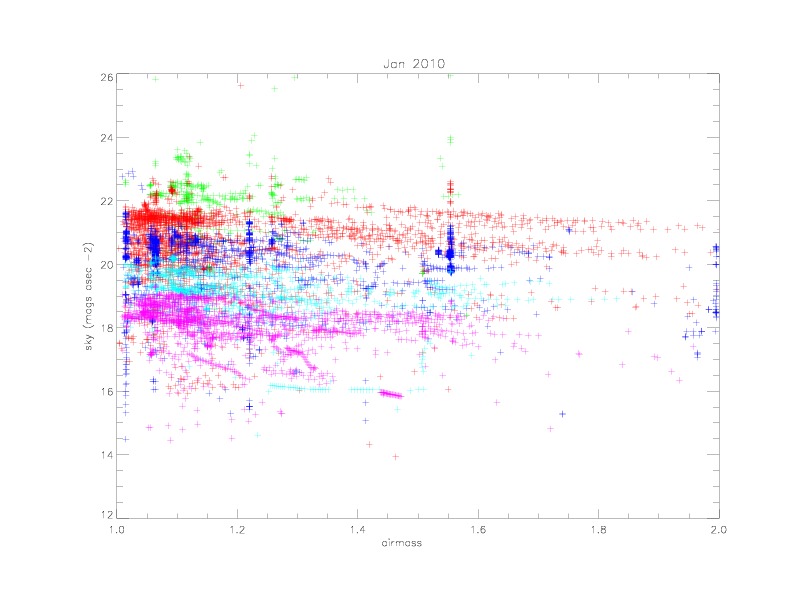
This wiki contains plots of sky brightness for January and February 2010. The selection was for exposures > 25s long, things that were not DARK or FLAT, with a background > 0 and from ota 33.
There are no other cuts.
The calculation for sky brightness assumes a bias of 7794, which is reasonable for chip 33, and uses E. Schafly's zero points.
The colors are as follows:
g = greenr = red
i = blue
z = cyan
y = purple


Attachments (6)
- gpc.plots4-0.jpg (54.7 KB ) - added by 17 years ago.
- gpc.plots4-1.jpg (64.4 KB ) - added by 17 years ago.
- gpc.plots4-2.jpg (70.8 KB ) - added by 17 years ago.
- gpc.plots4-3.jpg (75.5 KB ) - added by 17 years ago.
- gpc.plots4-4.jpg (62.6 KB ) - added by 17 years ago.
- gpc.plots4-5.jpg (74.2 KB ) - added by 17 years ago.
Download all attachments as: .zip
Note:
See TracWiki
for help on using the wiki.