| Version 20 (modified by , 14 years ago) ( diff ) |
|---|
Summary (Updated - AF 11/01/2012)
MOPS has reported some peculiar magnitudes in y-band MD data offsets and larger scatter compared to predictions of asteroid y-band magnitudes while the same comparison to 3PI photometry looks reasonable (both cases are photometry from the respective diffims). Also, have found photometry from Warp-Stack (WS) difference images for two sequential MD exposures unrealistically different by >0.5 mag.
Plot of average value for (observed - predicted) magnitudes per night for 3pi and MD detections in y-band.An offset in the MD data making objects ~0.4 mag brighter is seen.

Plot of average value for (observed - predicted) magnitudes per night for 3pi and MD detections in z-band. No offset is seen.

Example: MD10 sequential exposure pair, asteroid (12891) (Peter Vereš)
o6157g0218o
o6157g0219o

ra: 353.142622
ra: 353.142215

dec:-0.086658
dec: -0.086867
Chip/camera CAL_PSF_MAG photometry from the SMF catalogs below agree to what expected? yes, but can't be more exact because asteroid (12891) previously unstudied.
- o6157g0218o: 17.06
- o6157g0219o: 17.048
camera SMFs:
{{{
IPP_IDET  CAL_PSF_MAG  CAL_PSF_MAG_SIG  PSF_INST_MAG  PSF_INST_MAG_SIG  AP_MAG  PSF_MAJOR  PSF_QF_PERFECT  FLAGS  FLAGS2 rsep(")

2384872506.gpc1:MD10.nt:2012:08:18:o6157g0218o.512581:o6157g0218o.512581.cm.524588.smf
300 17.0643 0.116127 -12.2008  0.0112583 -12.2431 6.2846 0.999136 102760453.0 128.0 0.11619639245

2384878611.gpc1:MD10.nt:2012:08:18:o6157g0219o.512582:o6157g0219o.512582.cm.524591.smf
353 17.0482 0.119598 -12.2145 0.0109578 -12.2215 6.29196 0.999138 102760453.0 128.0 0.0714361641958
}}}

WSdiff CMFs:
{{{
IPP_IDET  CAL_PSF_MAG  CAL_PSF_MAG_SIG  PSF_INST_MAG  PSF_INST_MAG_SIG  AP_MAG  PSF_MAJOR  PSF_QF_PERFECT  FLAGS  FLAGS2  DIFF_NRATIO_BAD  rsep (")

2385003229.gpc1:MD10.nightlyscience:2012:08:18:MD10.V3:skycell.052:MD10.V3.skycell.052.WS.dif.272923.cmf
180 17.1593 0.0 -12.1058 0.0549115 -12.0586 6.91519 0.999313 35651585.0 2177.0 0.586518 0.00506595268768

2385006586.gpc1:MD10.nightlyscience:2012:08:18:MD10.V3:skycell.052:MD10.V3.skycell.052.WS.dif.272924.cmf
143 16.5429 0.0 -12.7198 0.0508926 -12.0717 10.5122 0.998732 35651585.0 129.0 0.614977 0.00257287140
}}}
== Example: MD09, TNO145452 (Alan Fitzsimmons) ==

TNO 145452
 * a bit faint but its' the best one I've found so far, as it stays in the field for a long long time.
 * in MD09 where we can predict the y magnitude should be within 0.1 mag of ~19.3 for the below observations
 * a bunch of y-band exposures in 2011 and 2012.
 * columns are Exp ID, MJD, RA, Dec.
{{{
2011:
o5756g0570o  55756.592040       333.326857   +0.597387
o5756g0571o  55756.595015       333.326815   +0.597377
o5756g0572o  55756.597969       333.326774   +0.597368
o5756g0573o  55756.600918       333.326733   +0.597359
o5756g0574o  55756.603875       333.326692   +0.597350
o5756g0576o  55756.609792       333.326609   +0.597332
o5756g0577o  55756.612748       333.326568   +0.597323
o5757g0356o  55757.496424       333.314491   +0.594541
o5757g0357o  55757.499384       333.314449   +0.594532
o5757g0358o  55757.502357       333.314407   +0.594522
o5757g0359o  55757.505335       333.314365   +0.594513
o5757g0360o  55757.508292       333.314323   +0.594503
o5757g0361o  55757.511248       333.314281   +0.594494
o5757g0362o  55757.514208       333.314239   +0.594484
o5757g0363o  55757.517163       333.314197   +0.594475
o5766g0299o  55766.477073       333.180973   +0.559502
o5784g0173o  55784.507883       332.868350   +0.454736
o5784g0174o  55784.510828       332.868295   +0.454715
o5784g0175o  55784.513776       332.868239   +0.454695
o5784g0176o  55784.516717       332.868184   +0.454674
o5784g0177o  55784.519667       332.868128   +0.454654
o5784g0178o  55784.522608       332.868073   +0.454633
o5784g0180o  55784.528498       332.867962   +0.454592

2012:
o6107g0064o  56107.597172       334.910525   +0.746688
o6107g0065o  56107.600110       334.910498   +0.746686
o6107g0066o  56107.603062       334.910470   +0.746684
o6107g0067o  56107.606006       334.910442   +0.746681
o6107g0068o  56107.608993       334.910414   +0.746679
o6201g0056o  56201.242691       333.383584   +0.125386
o6201g0057o  56201.245657       333.383540   +0.125358
o6201g0058o  56201.248616       333.383497   +0.125330

}}}

This is the best example in the database because of the density of measurements and the known small amplitude of any lightcurve. In warp-warp diffs the slow motion will mean that 3PI and OSS measurements would be incorrect due to self-subtraction of the flux. But this should not only occur in MD fields as MOPS is being fed warp-stack measurements, and it would make the object fainter not brighter as seen. The variation in z-band and in other filters in 2012 is also puzzling.

Plot of observed magnitudes converted to V (top), and residual of magnitude (observed - predicted), in 2011 and 2012:
(Key: g=green, r=red,i=orange,z=purple,y=cyan)
[[Image(145452.png)]]


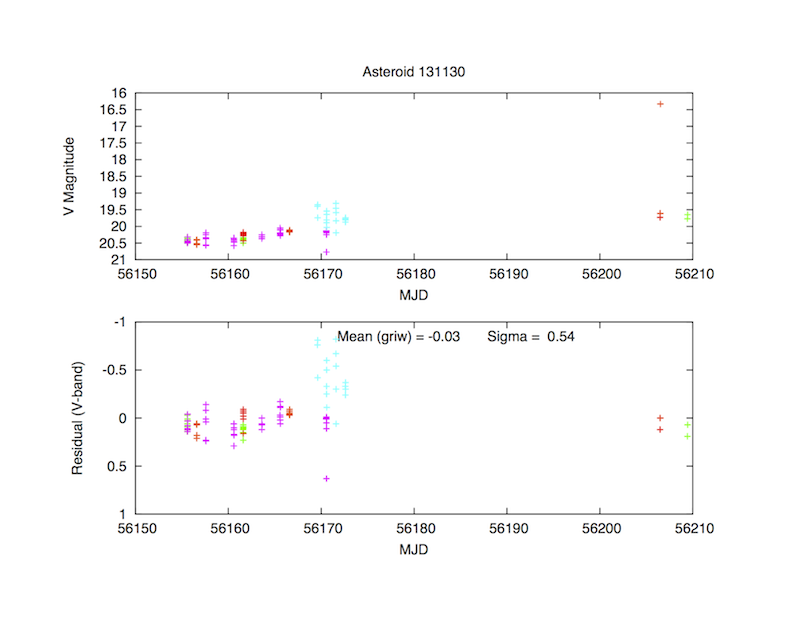
== Example: MD01, MBA 131130  (Alan Fitzsimmons) ==

This is a nice example of the offset plus large scatter in y-band for a Main Belt Asteroid seen this year.
{{{
o6169g0184o 36.353429    -4.350323
o6169g0185o 36.353441    -4.350616
o6170g0586o 36.360948    -4.446235
o6170g0588o 36.360938    -4.446831
o6170g0590o 36.360927    -4.447427
o6170g0591o 36.360922    -4.447725
o6170g0593o 36.360911    -4.448320
o6171g0613o 36.362699    -4.549196
o6171g0614o 36.362676    -4.549499
o6171g0616o 36.362631    -4.550103
o6171g0617o 36.362608    -4.550406
o6171g0619o 36.362562    -4.551012
o6172g0677o 36.358383    -4.654112
o6172g0682o 36.358181    -4.655647
o6172g0683o 36.358141    -4.655956
o6172g0684o 36.358101    -4.656264
}}}


Plot of observed magnitudes converted to V (top), and residual of magnitude (observed - predicted) in 2012. The large gap in the data was caused by telescope shutdown due to rotator problems.
(Key: g=green, r=red,i=orange,z=purple,y=cyan)
[[Image(131130.png)]]
Attachments (11)
-
145452.png
(144.7 KB
) - added by 14 years ago.
lightcurve of 145452 in MD09
-
131130.png
(97.0 KB
) - added by 14 years ago.
131130 lightcurve in MD01
-
y_ubercal.png
(55.7 KB
) - added by 14 years ago.
mean y-band (O-C)
-
z_ubercal.png
(60.7 KB
) - added by 14 years ago.
Mean z-band (O-C)
- smfdiffcmfv0_y.png (54.3 KB ) - added by 14 years ago.
- smfdiffcmfv1b300_y.png (53.4 KB ) - added by 14 years ago.
- smfwrpcmf_y.png (53.4 KB ) - added by 14 years ago.
- warpdiffcmfv0_y.png (53.4 KB ) - added by 14 years ago.
- smfdiffcmflstori_PS1-12sn_md05s031i.png (51.5 KB ) - added by 14 years ago.
- smfdiffcmflstv0_PS1-12sn_md05s031i.png (52.4 KB ) - added by 14 years ago.
- smfdiffcmflstv1b300_PS1-12sn_md05s031i.png (52.5 KB ) - added by 14 years ago.
Download all attachments as: .zip