| Version 6 (modified by , 14 years ago) ( diff ) |
|---|
Summary (in process of updating)
MOPS has reported some peculiar magnitudes in y-band MD data offsets and larger scatter compared to predictions of asteroid y-band magnitudes while the same comparison to 3PI photometry looks reasonable (both cases are photometry from the respective diffims). Also, have found photometry from Warp-Stack (WS) difference images for two sequential MD exposures unrealistically different by >0.5 mag.
Example: MD10 sequential exposure pair, asteroid (12891) (Peter Vereš)
o6157g0218o
o6157g0219o

ra: 353.142622
ra: 353.142215

dec:-0.086658
dec: -0.086867
Chip/camera photometry from the SMF catalogs below agree to that expected -- yes, but can't be more exact because asteroid (12891) previously unstudied.
o6157g0218o: 17.06 o6157g0219o: 17.048
Example: MD09, TNO145452 (Alan Fitzsimmons)
TNO 145452
- a bit faint but its' the best one I've found so far, as it stays in the field for a long long time.
- in MD09 where we can predict the y magnitude should be within 0.1 mag of ~19.3 for the below observations
- a bunch of y-band exposures and positions on two separate dates:
o6107g0064o  334.194813  +0.274227
o6107g0065o  334.199167  +0.283357
o6107g0066o  334.194763  +0.292497
o6107g0067o  334.184892  +0.294695
o6107g0068o  334.176975  +0.288368
o6201g0056o  334.176975  +0.288387
o6201g0057o  334.176992  +0.278257
o6201g0058o  334.184921  +0.271952
Although this is the best example in the database because of the density of measurements and the known small amplitude of any lightcurve, we may be misled because of the slow motion of the object causing problems in brightness measurements. But this will only occur if MOPS is being fed warp-warp measurements instead of warp-stack, and it should make the object fainter, not brighter as seen. The variation in z-band and in other filters in 2012 is also puzzling:
Plot of observed magnitudes converted to V (top), and residual of magnitude (observed - predicted), in 2011 and 2012:
(Key: g=green, r=red,i=orange,z=purple,y=cyan)

Example: MD09, TNO145452 (Alan Fitzsimmons)
Attachments (11)
-
145452.png
(144.7 KB
) - added by 14 years ago.
lightcurve of 145452 in MD09
-
131130.png
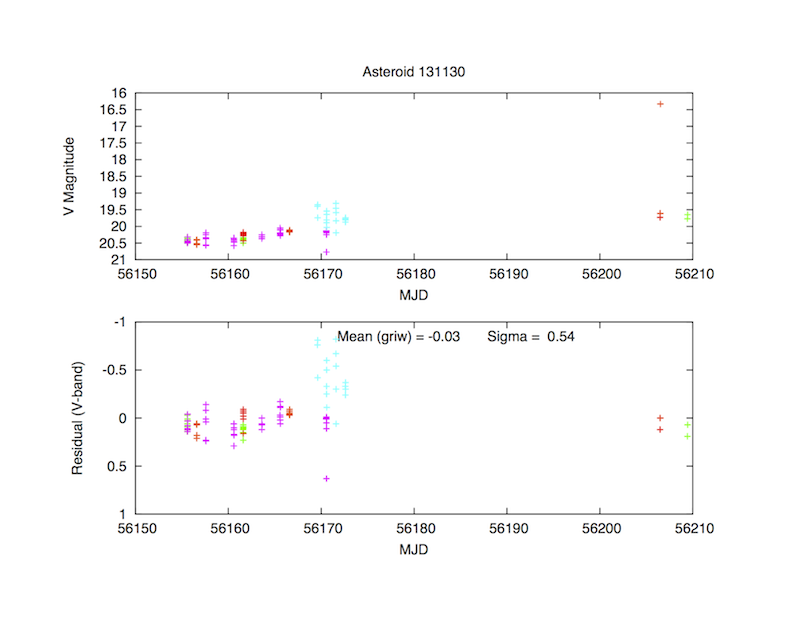
(97.0 KB
) - added by 14 years ago.
131130 lightcurve in MD01
-
y_ubercal.png
(55.7 KB
) - added by 14 years ago.
mean y-band (O-C)
-
z_ubercal.png
(60.7 KB
) - added by 14 years ago.
Mean z-band (O-C)
- smfdiffcmfv0_y.png (54.3 KB ) - added by 14 years ago.
- smfdiffcmfv1b300_y.png (53.4 KB ) - added by 14 years ago.
- smfwrpcmf_y.png (53.4 KB ) - added by 14 years ago.
- warpdiffcmfv0_y.png (53.4 KB ) - added by 14 years ago.
- smfdiffcmflstori_PS1-12sn_md05s031i.png (51.5 KB ) - added by 14 years ago.
- smfdiffcmflstv0_PS1-12sn_md05s031i.png (52.4 KB ) - added by 14 years ago.
- smfdiffcmflstv1b300_PS1-12sn_md05s031i.png (52.5 KB ) - added by 14 years ago.
Download all attachments as: .zip