| Version 9 (modified by , 17 years ago) ( diff ) |
|---|
We have been working to reduce the number of false-positive detections from magic in GPC1 images.
We spent several days this past week (2009.06.22) improving the static mask, and this has had an important effect on improving the quality of the magic analysis. Unfortunately, it is not a complete or sufficient solution.
The following images illustrate the remaining effects which are triggering magic false positives:
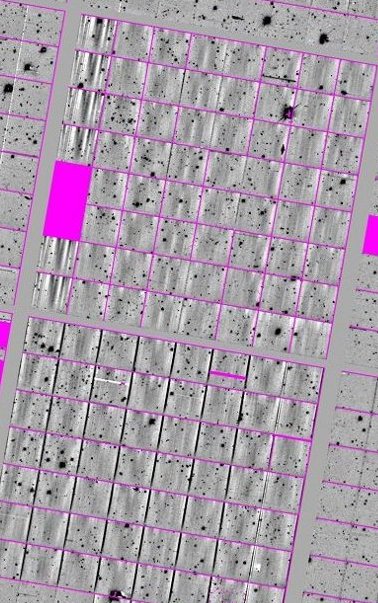
The first two images show the streaks identified by magic in an example image:
 | 
|
The image on the right shows the locations of features detected by magic. The green regions are the actual contributing pixels while the black bands show the determined boundaries of the full streak (a streak may only be detected in a small number of segments). The image on the left shows a greyscale jpeg of the full exposure, rotated and cropped to match the streak detection image on the right.
First, there is only a single real satellite streak in this image, and it is easily detected. However, there are many false positives. It is clear from their orientation along the camera rows and/or columns that most of the false streaks are due to artifacts in the image associated with the camera structures. A closer examination reveals several types of artifacts. Three regions are marked in the greyscale image. Below, we show some images to illustrates these effects more closely:
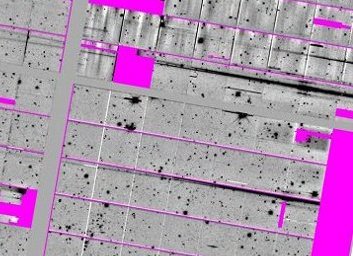
1) tiltystreak artifacts:

This image is a zoom-in on a region of the greyscale image above. In this region, one may see two effects caused by tiltystreak. The first, in the left-most column of cells in the upper-most chip, consists of over-corrections (note that although this set of cells appears as a column, it is in fact a row -- the image is oriented to match celestial coordinates). This is a hazard of tiltystreak; it is possible that these cells would be better behaved if they were excluded from tiltystreak. The second effect is seen in the lower chip: the edges of many of the cells are high. This is again an artifact of tiltystreak. We can certainly avoid this case by masking the first few and last few rows of the affected cells. Our previous round of masking attempted to catch these cases, but was not complete. It is also possible that tiltystreak can be improved to avoid this particular effect.
In the longer term (beyond this initial desire to deliver MD field data to the consortium), we will need to decide with a larger set of data which cells / chips are better handled by applying tiltystreaks, and which would be better without it. It may be the case that the choice depends on the conditions, or perhaps which need a statistic to judge if the application improves the image or not (would a simple robust measure of the cell noise be sufficient?)
2) glints:

This image is another zoom on the greyscale image above. In this case, there are two glints which are visible starting at the right side of the image and running roughly parallel with the cell edges. There are several such glints visible in the larger image, at least two on each of the left and right sides of the focal plane. We have seen these structures in many images, and it is generally clear what is happening: a bright star is falling on a structure on the edge of the focal plane and reflecting off a roughly 45 degree surface. Exactly what the reflection sources are is unclear. The geometry of the glints is telling us something about what they could be -- we usually (always?) see glints which are parallel to the chip edges, and usually from the top & bottom of the camera, as in this case (keep in mind the rotation). For now, I think we will have to accept these as extra streak sources. With some effort, perhaps we can determine the physical location of the glint sources and determine the stars causing the glints; if they can be well modeled, then they can be masked in the camera stage just as ghosts and other features generated by stars are currently masked.
3) Other structures:
 | 
|
These two images illustrate two types of artifacts: persistent charge and glow structures. The image on the right is the raw image used in the analysis above. The image on the left shows the same pixel region for a different image, in this case one of a number of short g-band exposures used to improve the static masking.
Several of the features are caused by glow spots that are stronger in this exposure than in our earlier guide (the structure in cell 2,3 counting from 0,0 i the lower left; and the right-most structure in cell 3,0). This illustrates the challenge of masking the glow / dark structures in these images: The glow structures change significantly from image to image. We have previously masked two glow sources in this region. However, in this exposure, the previous masking was not sufficient, and significant signal is leaking around the edges of the masks. The conditions under which the significant glow appears is not well understood. It may be that the temperature of the chip is the important factor, but we only know the temperature of the package, and they can be quite different. It may be that this glow is triggered by video in some cell in another part of the chip -- this type of behavior is seen in other chips and cell (to a much stronger degree -- some cells saturate, or nearly, when video is on elsewhere in their chip). This is a serious problem: since we cannot predict when the glow will be significant, we can only increase the size of the mask in these areas. This means we lose area that is often acceptable because of the need to avoid losing much more area to magic occasionally.
The other features are persistent star trails which were not corrected by burntool. These structures are seen in other parts of this exposure. I am somewhat surprised that burntool left these behind. It is certain that this exposure was processed by burntool, but I wonder if there was a failure of some sort in the processing or the sequencing. We can double check that burntool has entries from the previous exposures. It might simply be that the decay timescale is not long enough so that these escaped the burntool algorithm. Assuming that burntool was correctly run on the exposures in this sequence, then we will have to accept these type of artifacts until burntool can be improved.
We have also had concerns that some of the Magic false positives are caused by fractional errors in the variance. We have found that the GPC1 data processed to the difference level has a higher pixel-to-pixel standard deviation in the background than expected from the noise propagation. In the case of the exposure above, the effect ranges from about 15% to 25% (ie, stdev is 15% to 25% higher than expected). We have shown that this effect does not appear in our simulated data analysis, which seems to suggest it is not caused by the software specifically. The last four images illustrate the impact of an error in the variance level of this scale.

|

|

|

|
In conclusion, there are a number of camera ar
Attachments (4)
- xy66a.jpg (198.4 KB ) - added by 17 years ago.
- xy66b.jpg (195.8 KB ) - added by 17 years ago.
- tiltystreak.artifacts.jpeg (85.9 KB ) - added by 17 years ago.
- glints.jpeg (31.9 KB ) - added by 17 years ago.
Download all attachments as: .zip