| Version 4 (modified by , 18 years ago) ( diff ) |
|---|
up to PS1_GPC1_Rotator_Measurements
2008.09.30
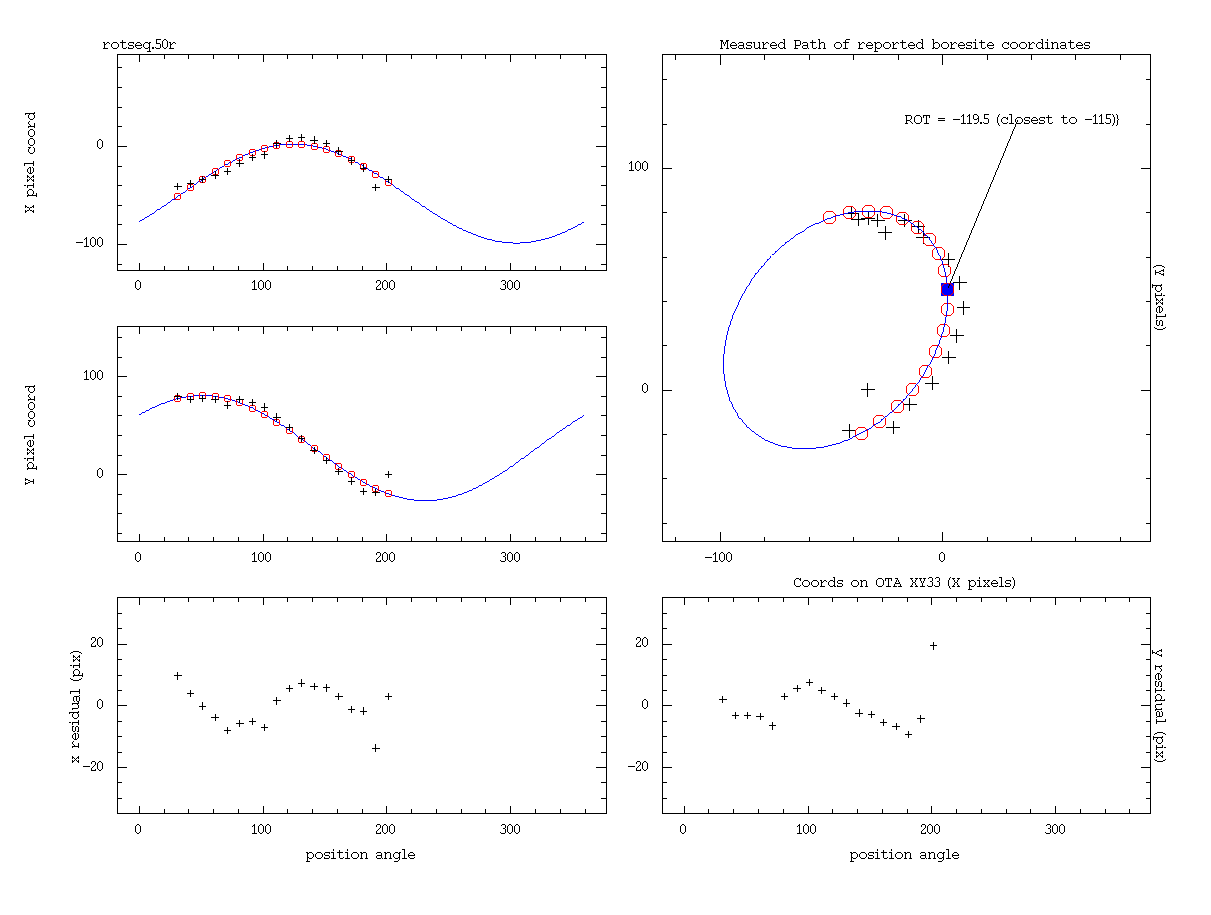
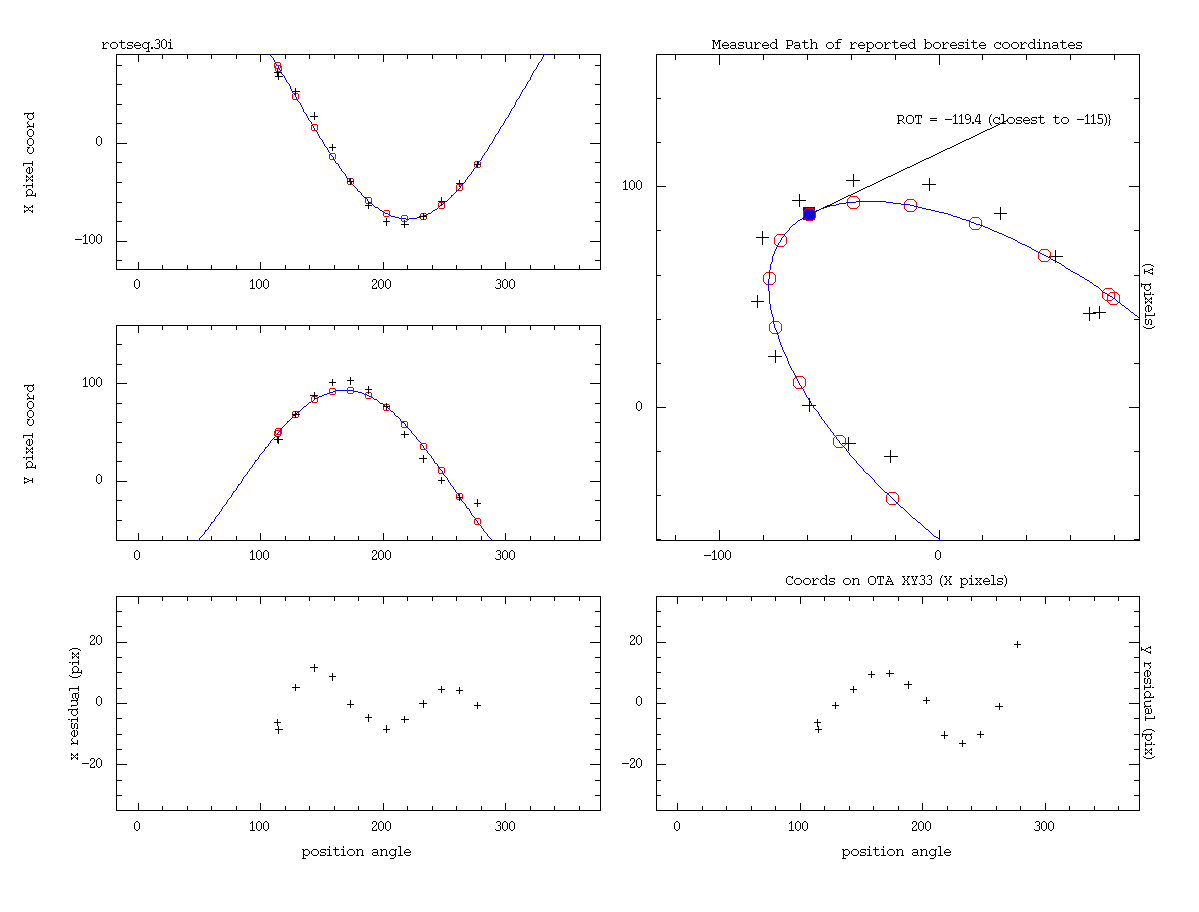
I've performed my analysis of the fitted vs observed boresite positions for the 20080915 data that JT was discussing a bit today. I've done the same fits as before: modeling the path of the boresite offset as an ellipse. The boresite offset is defined to be the distance in pixels that the boresite coordinate is shifted relative to the center of the camera (midway between ota 33 cell 00 pixel 00 and ota 44 cell 00 pixel 00). I've cleaned up the plot to show in one graph the path in X,Y coordinates as well as the following values vs position angle: the X-offset, the Y-offset, the X-offset residual, and the Y-offset residual. The residuals are the difference between the observed offset and the fit to the elliptical model. Per confusion from Jeff, I've adjusted plot of the path to have an aspect ratio of 1 and a fixed scale for all of the attached plots (220x220 pixels). I've also added a mark to represent on the path the position for which the rotator was closest to -115.
Attached are plots for the g & r sequences from 20080915 and the i sequence from 20080827. The quality of the astrometry solutions was worse for 20080915: there were fewer stars in these fields, and I've had to reject a few points that were seriously outside the observed trends. Below are the fitted ellipse parameters for each data set. My initial impressions are:
1) g & i both seem to confirm the trend that the boresite error in the X direction gets larger for lower altitude, but that the in the Y direction it is generally constant. for the altitudes 70, 50, 30: RX(g) = 52, 77, 92; RX(i) = 75, 108, 145; RY(g) = 39,45,55; RY(i) = 53, 59, 67. So, some growth in the Y-direction, but much less than in X.
2) the r-band data, taken the same night as the g-band data does not agree well with these trends: RX(r) = 45, 43, 60; RY(r) = 48, 59, 88. It seems that for this r-band sequence, the trend is flipped (X nearly constant, Y grows with decreasing altitude).
any one else have other thoughts? this does not seem to be a simple trend of the offset as a function of rotator angle and altitude...
gene
| ALT | filter | Lo | Mo | RX | RY |
| deg | pixels | pixels | pixels | pixels | |
| 70 | g | -64.5 | -4.6 | -52.2 | 39.0 |
| 70 | r | -16.8 | 80.0 | -60.4 | 48.1 |
| 70 | i | 10.7 | -14.9 | 75.9 | 53.3 |
| 50 | g | -24.8 | -52.0 | -77.1 | 45.9 |
| 50 | r | -48.1 | 27.1 | -43.8 | 59.1 |
| 50 | i | 21.1 | -14.0 | 108.7 | 59.5 |
| 30 | g | 18.8 | -71.3 | -92.7 | 55.6 |
| 30 | r | -71.3 | 33.6 | -45.2 | 88.2 |
| 30 | i | 45.2 | -9.3 | 145.0 | 67.4 |
---
| ALT | approx altitude for rotator sequence |
| Lo | center of path of reported boresite position (X pixels on OTA 33) |
| Mo | center of path of reported boresite position (Y pixels on OTA 33) |
| RX | radius of elliptical path (pixels) |
| RY | radius of elliptical path (pixels) |


Attachments (9)
- rotseq.30g.png (15.0 KB ) - added by 18 years ago.
- rotseq.30r.png (14.0 KB ) - added by 18 years ago.
- rotseq.50g.png (14.8 KB ) - added by 18 years ago.
- rotseq.50r.png (14.6 KB ) - added by 18 years ago.
- rotseq.70g.png (13.5 KB ) - added by 18 years ago.
- rotseq.70r.png (13.7 KB ) - added by 18 years ago.
- rotseq.30i.png (14.3 KB ) - added by 18 years ago.
- rotseq.50i.png (14.8 KB ) - added by 18 years ago.
- rotseq.70i.png (13.9 KB ) - added by 18 years ago.
Download all attachments as: .zip