| Version 11 (modified by , 15 years ago) ( diff ) |
|---|
Raw Images Files in Nebulous
Shuffling Analysis
(Unless noted all files are referenced from /export/ippc11.1/schastel/FilesStatistics/slocate on host ippc11)
On week 5 (i.e. around 1/30/2012-2/3/2012), the slocate utility was ran on the different cluster nodes hosting data. Those databases can be found in slocate_entries.
From those databases, the number of raw images files for gpc1 were extracted for each host, for each ota, and for each nebulous first-level directory (that is, one of the 256 directories from /export/<hostname>.0/nebulous/00, /export/<hostname>.0/nebulous/01, ..., /export/<hostname>.0/nebulous/ff). The script slocate_statistics_multiple.py has been used to create the files in slocate_data (the script can be executed: slocate_statistics_multiple.py <hostname_1> ... <hostname_n> and creates the files slocate_data/<hostname_1>...)
Note: 60 nodes are hosting the data (namely: ipp006, ipp007, ipp008, ipp009, ipp010, ipp011, ipp012, ipp013, ipp014, ipp015, ipp016, ipp017, ipp018, ipp019, ipp020, ipp021, ipp023, ipp024, ipp025, ipp026, ipp027, ipp028, ipp029, ipp030, ipp031, ipp032, ipp033, ipp034, ipp035, ipp036, ipp037, ipp038, ipp039, ipp040, ipp041, ipp042, ipp043, ipp044, ipp045, ipp046, ipp047, ipp048, ipp049, ipp050, ipp051, ipp052, ipp053, ipp054, ipp055, ipp056, ipp057, ipp058, ipp059, ipp060, ipp061, ipp062, ipp063, ipp064, ipp065, ipp066)
On the ippc11 mysql server, the FilesStatistics database was created:
CREATE DATABASE FilesStatistics;
USE FilesStatistics;
CREATE TABLE RawImages (id INT PRIMARY KEY AUTO_INCREMENT,
                        host CHAR(7), INDEX(host),
                        directory CHAR(3), INDEX(directory),
                        ota CHAR(6), INDEX(ota),
                        how_many INT, INDEX(how_many));
It has been populated with the various files from slocate_data.
cat slocate_data/* | sed 's/^/INSERT INTO RawImages(host, directory, ota, how_many) VALUES /g' | sed 's/$/;/g' > populate.sql
cat populate_db.sql | mysql -u ippuser -pipp FilesStatistics
- Average number of ota files by host:
SELECT SUM(how_many)/60 FROM RawImages;: 580145 - Difference (absolute and relative) between that average number and the current number on one host:
SELECT host, SUM(how_many)-580145 AS adiff, (SUM(how_many)-580145)/580145*100 AS rdiff FROM RawImages GROUP BY host; - View without the directory information:
CREATE VIEW RawImagesSimple AS (SELECT host, ota, SUM(how_many) AS ota_count FROM RawImages GROUP BY host, ota);
Maxima in terms of ota counts
- To get the maximum in terms of ota counts for each host (we also display the argmax), run the following statement:
SELECT RI1.host, RI1.ota, max_ota_count FROM RawImagesSimple RI1 JOIN (SELECT MAX(RI2.ota_count) AS max_ota_count, host FROM RawImagesSimple RI2 GROUP BY host) RI3 ON RI3.max_ota_count = RI1.ota_count AND RI3.host=RI1.host ORDER BY RI1.ota;
- Two otas are not displayed: ota23 and ota35. This means that no node has a majority of ota23 and ota35. However there are 301127 ota23 on ipp015 (while the maximum on this host is reached for ota43 with 305879) and 308061 ota35 on ipp013 (Max on this host for ota20: 310086). The absolute difference between the maximum ota count and the ota count for ota23 and ota35 is however acceptable (~4,000 and ~2,000) if it is compared to the total number of otas (~300,000).
- Some nodes have a relative small number of exposures: ipp026 (63678), ipp045(13804), ipp064(8736), ipp066(95218). We know those nodes had problems in the past and can exclude them from our study. We will refer to them as "outlier nodes".
- Two otas are shown twice: ota17 (ipp060 and ipp026) and ota34 (ipp023 and ipp045) but for each of them one of the nodes has a small number of exposures. Nothing to worry about here too.
- Without the outlier nodes (ipp026, ipp045, ipp064, and ipp066):
- Mean max count: 274682
- Stdev max count: 41327
- Max of max count: 376716
- Min of max count: 201702
- Hosts with abs(max count - mean > 3*stdev): 0
- Hosts with abs(max count - mean > 2*stdev): 1 => ipp033 (+102034)
- Hosts with abs(max count - mean > 1*stdev): 12 (i.e. 5 nodes with max count greater than mean+sigma; 7 with max count less than mean-sigma)
- Queries derived from
SELECT RI1.host, RI1.ota, max_ota_count-274682 AS delta FROM RawImagesSimple RI1 JOIN (SELECT MAX(RI2.ota_count) AS max_ota_count, host FROM RawImagesSimple RI2 WHERE host != 'ipp026' AND host != 'ipp045' AND host != 'ipp064' AND host != 'ipp066' GROUP BY host) RI3 ON RI3.max_ota_count = RI1.ota_count AND RI3.host=RI1.host ORDER BY delta DESC;
- A table containing the maxima by ota was created:
RawImagesMaximaByOtaCREATE TABLE RawImagesMaximaByOta (id INT PRIMARY KEY AUTO_INCREMENT, host CHAR(7), INDEX(host), ota CHAR(6), INDEX(ota), max_ota_count INT, INDEX(max_ota_count)); INSERT INTO RawImagesMaximaByOta SELECT NULL, RI1.host, RI1.ota, max_ota_count FROM RawImagesSimple RI1 JOIN (SELECT MAX(RI2.ota_count) AS max_ota_count, host FROM RawImagesSimple RI2 WHERE host != 'ipp026' AND host != 'ipp045' AND host != 'ipp064' AND host != 'ipp066' GROUP BY host) RI3 ON RI3.max_ota_count = RI1.ota_count AND RI3.host=RI1.host;
Are OTAs which are not supposed to be targeted on one host evenly spread?
- Table based on RawImagesSimple without the maximum ota counts is named:
RawImagesWithoutMaximumOtaCREATE TABLE RawImagesWithoutMaximumOta (host CHAR(7), INDEX(host), ota CHAR(6), INDEX(ota), ota_count INT, INDEX(ota_count)); INSERT INTO RawImagesWithoutMaximumOta SELECT host, ota, ota_count FROM RawImagesSimple WHERE (SELECT COUNT(*) FROM RawImagesMaximaByOta WHERE RawImagesMaximaByOta.host = RawImagesSimple.host AND RawImagesMaximaByOta.ota = RawImagesSimple.ota) = 0 AND host != 'ipp026' AND host != 'ipp045' AND host != 'ipp064' AND host != 'ipp066';
- Remove the outliers from the
RawImagesWithoutMaximumOtatable:CREATE TABLE RawImagesWithoutMaximumOtaNoOutliers (host CHAR(7), INDEX(host), ota CHAR(6), INDEX(ota), ota_count INT, INDEX(ota_count)); INSERT INTO RawImagesWithoutMaximumOtaNoOutliers SELECT * FROM RawImagesWithoutMaximumOta; DELETE FROM RawImagesWithoutMaximumOtaNoOutliers WHERE ota_count>300000; -- (Those are the "missing but there" ota23 and ota35)
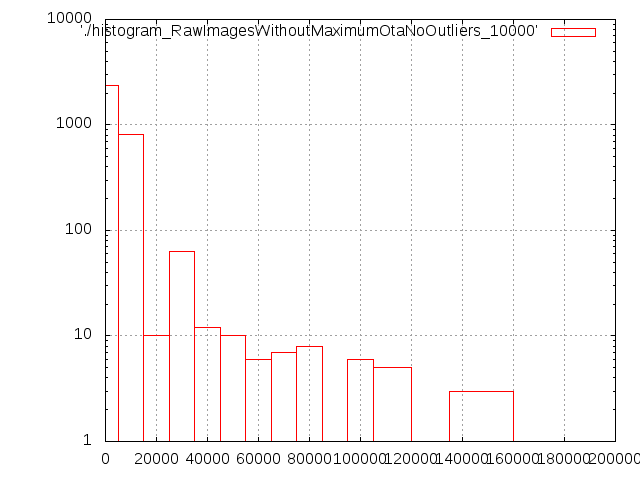
- Now to get an idea on how the ota are spread the hosts, let's display the histogram of their values in
RawImagesWithoutMaximumOta.
First with a (huge) bucket size of 100,000 (Note the log scale for the y axis):
SELECT ROUND(ota_count, -4) AS bucket, COUNT(*) FROM RawImagesWithoutMaximumOtaNoOutliers GROUP BY bucket;

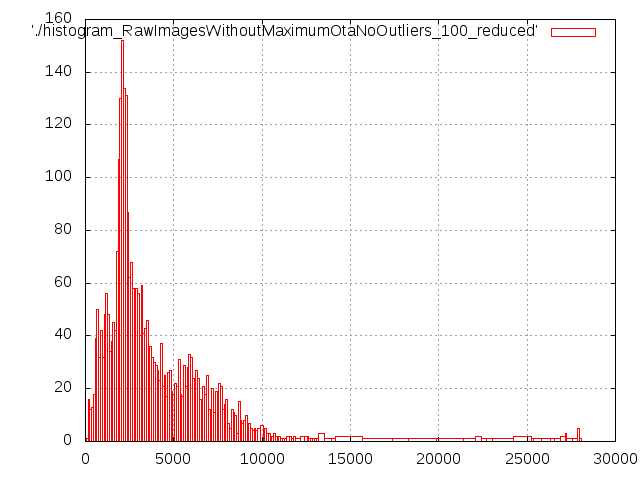
We are interested in the detail of the first part of the histogram. With a bucket size of 100:
SELECT ROUND(ota_count, -2) AS bucket, COUNT(*) FROM RawImagesWithoutMaximumOtaNoOutliers GROUP BY bucket LIMIT 150;

Attachments (4)
- histogram_RawImagesWithoutMaximumOtaNoOutliers_10000.png (5.5 KB ) - added by 15 years ago.
- histogram_RawImagesWithoutMaximumOtaNoOutliers_100.png (6.2 KB ) - added by 15 years ago.
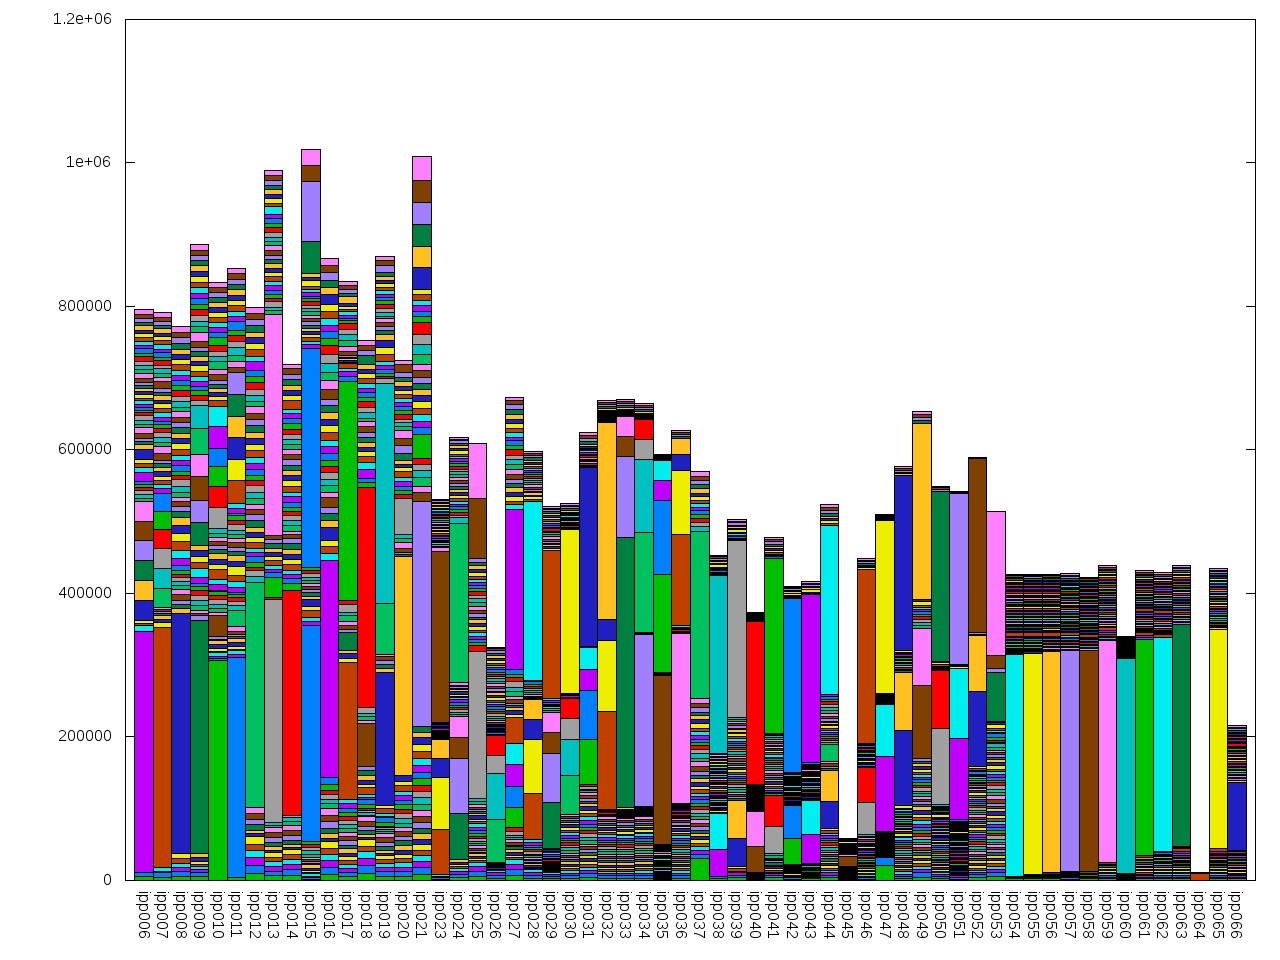
- otasByHost.jpg (263.1 KB ) - added by 15 years ago.
- ipp006_small.jpg (16.0 KB ) - added by 15 years ago.
Download all attachments as: .zip