| Version 3 (modified by , 13 years ago) ( diff ) |
|---|
The upcoming reduction of SAS SAS.32 contains some recent improvements in the extended source model fits.
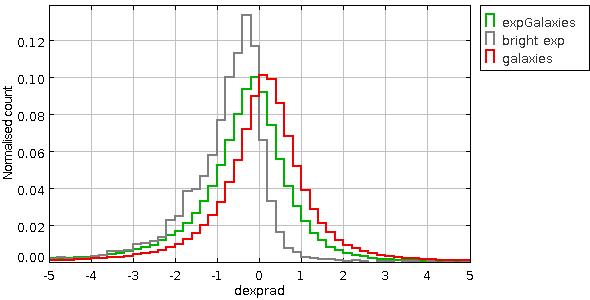
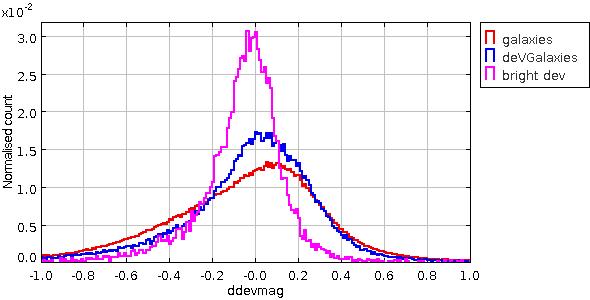
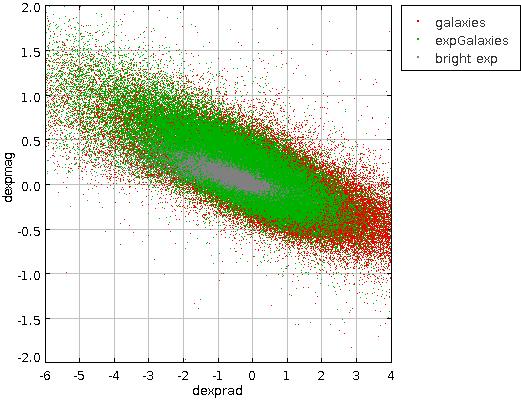
The following plots so differences between SDSS radius and magnitude measurements and the SAS.32 psphotStack results (after applying the zero point correction measured by the IPP sky calibration stage). Radius measurements are in PS1 skycell pixels (.25 arc seconds per pixel). 436 r band stacks from the central 8 x 8 degree area of the SAS2 field.
In the following, "expGalaxies" are ones for which SDSS reports devFrac_r == 0. "devGalaxies" are ones with devFrac_r == 1. "Bright" is r < 19.5
Exponential Models
Histograms of exponential radius and magnitude differences.


And scatter plot of dexpmag versus dexprad

de Vaucouleurs Models
Histograms of radius and magnitude differences.


And scatter plot of ddevmag versus ddevrad

Attachments (6)
- dexprad_hist.jpg (25.4 KB ) - added by 13 years ago.
- dexpmag_hist.jpg (28.1 KB ) - added by 13 years ago.
- ddevmag_ddevrad.jpg (59.9 KB ) - added by 13 years ago.
- ddevmag_hist.jpg (28.5 KB ) - added by 13 years ago.
- ddevrad_hist.jpg (27.7 KB ) - added by 13 years ago.
- dexpmag_dexprad.jpg (49.6 KB ) - added by 13 years ago.
Download all attachments as: .zip