| Version 19 (modified by , 15 years ago) ( diff ) |
|---|
Go to: http://svn.pan-starrs.ifa.hawaii.edu/trac/ipp/wiki/Zoology
Introduction
This page details the investigations into the high number of false detections reported by the Durham group. Durham reported around 400,000 false-detections across all exposures in the SAS footprint survey.
Procedure
We decided to populate a MySQL database consisting of all the columns in the false detection FITS files sent to us by the Durham group, enabling us to easily query the data and experiment with various cuts on flags, flux errors etc. Serge populated the database on his desktop machine.
Heather was able to overlay the locations of the false detections on top of the actual images, allowing to visualize the data during the various cuts.
Cutting using flags
I made some cuts and found some things:
There are 397521 false detections. Of these, there are only 45 different 'flags' that are used:
select count(*), flags, flags2 from FalsePositives group by flags;
Gives:
+----------+-----------+--------+
| count(*) | flags     | flags2 |
+----------+-----------+--------+
|      128 |   2107393 |    128 |
|      791 |  35653633 |    128 |
|        1 |  35653645 |    160 |
|        1 |  35653889 |    224 |
|      454 |  35661825 |    128 |
|       24 | 102762501 |    192 |
|   108851 | 169869313 |    208 |
|      191 | 169869325 |    208 |
|       11 | 169869333 |    192 |
|        1 | 169869389 |    128 |
|    26004 | 169869441 |    192 |
|       51 | 169869453 |    192 |
|       61 | 169869569 |    192 |
|       53 | 169869577 |    192 |
|        1 | 169869641 |    128 |
|       69 | 169869697 |    192 |
|       23 | 169869705 |    192 |
|   224897 | 169885697 |    240 |
|      315 | 169885701 |    224 |
|        1 | 169885761 |    192 |
|      444 | 169885953 |    192 |
|       56 | 169885961 |    192 |
|        2 | 169885969 |    192 |
|        8 | 170917889 |    192 |
|        5 | 170917901 |    240 |
|        8 | 170918017 |    208 |
|        1 | 170918029 |    224 |
|        6 | 203423749 |    128 |
|        4 | 203423877 |    128 |
|     2865 | 236978181 |    128 |
|      315 | 236978245 |    128 |
|      119 | 236978309 |    128 |
|     3780 | 236994567 |    192 |
|      294 | 236994597 |    128 |
|        4 | 236994631 |    192 |
|       26 | 238026757 |    144 |
|       19 | 238026885 |    224 |
|        2 | 238043143 |    240 |
|        1 | 241172485 |    192 |
|      618 | 268437504 |    128 |
|        3 | 268437760 |    128 |
|        1 | 268437768 |    128 |
|    21738 | 402685952 |    128 |
|     5273 | 402686080 |    128 |
|        1 | 403734656 |    128 |
+----------+-----------+--------+
45 rows in set (1.40 sec)
Most lump into only a handful of flags.
I did investigations of flag2 first, because there are fewer of those. I did cuts to remove 64,32,16,8, since those all had to do with mask, cosmicray, burntool, starspikes (ON_SPIKE, ON_STARCORE, ON_BURNTOOL, ON_CONVPOOR), which are not necessary objects we want to count.
I then cut the following using the flag field
- DEFECT
- SATURATED
- CR_LIMIT
- EXT_LIMIT
- SIZE_SKIPPED
These seemed like reasonable candidates for flags that maybe should be used to filter out bad detections.
I also did cuts to remove NULL mags (is there any mag which should ALWAYS be calculated? I can cut on that instead of the mag I cut)
select count(*), flags, flags2
from FalsePositives
where (!(flags2 & 64)
and !(flags2 & 32)
and !(flags2 & 16)
and !(flags2&8)
and !(flags & 2048)
and !(flags & 4096)
and !(flags&8192)
and !(flags&16384)
and !(flags&268435456))
and !(cal_psf_mag is null)
group by flags,flags2;
Here's what we have left:
+----------+-----------+--------+
| count(*) | flags     | flags2 |
+----------+-----------+--------+
|    55035 | 169869313 |    128 |
|       12 | 169869325 |    128 |
|        1 | 169869389 |    128 |
|      191 | 169869441 |    128 |
|        2 | 169869569 |    128 |
|        8 | 169869577 |    128 |
|        1 | 169869641 |    128 |
|        3 | 169869697 |    128 |
|        6 | 203423749 |    128 |
|        4 | 203423877 |    128 |
|      959 | 236978181 |    128 |
|      252 | 236978245 |    128 |
|       75 | 236978309 |    128 |
|        8 | 238026757 |    128 |
|        1 | 238026885 |    128 |
+----------+-----------+--------+
15 rows in set (0.24 sec)
for a total of 56558 false detections.
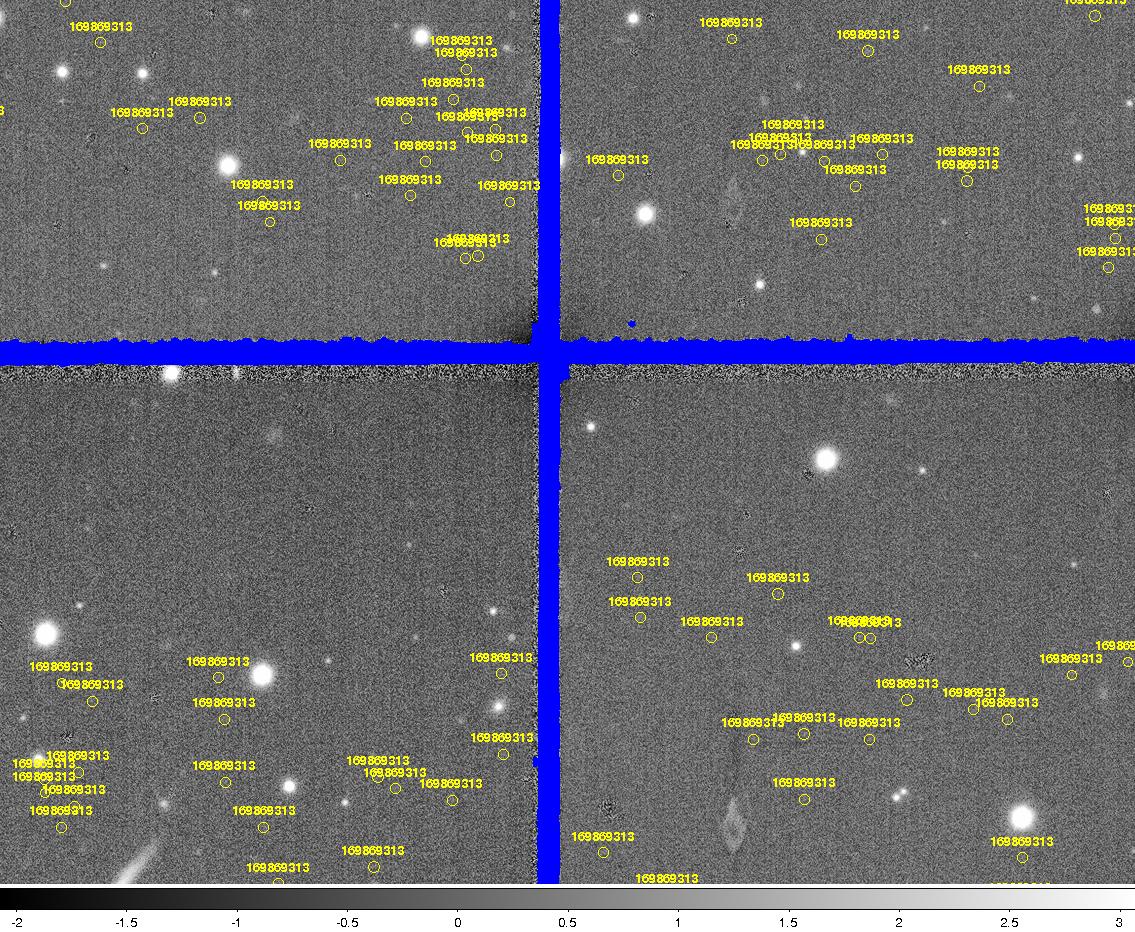
I investigated flag 169869313, which contains most of the false detections. Unfortunately, the flag is not interesting (it did a fit, it calculated a mag, etc), there are no further things to cut out. So, I created region files for the remaining false detections (see /data/ipp009.0/heather/heather), and looked at a few of the ones that had the largest number of detections. I see nothing that stands out:

The numbers represent the flag setting, and the circles are the remaining false detections.
This is AFTER I did the flag cuts. Prior to that there were 8x as many detections, often landing on burntools and edges.
Eye-balling the images confirmed that this method removed the majority of 'obvious' false detections, such as those on the edges of chips or in areas of saturation from a bright star.
Cutting using error in flux
We looked at the error in the flux, specifically, FLUX_SIG compared to FLUX. By eliminating all detections with a an error greater than 5% of the total flux, we were left with just 2000 detections, a reduction (from 56,000) of about 96%.
We generated histograms of flux_sig/flux for all of the non-detections and for the non-detections after the flag cuts.


Filter Dependence
Are the false positives filter dependent? A quick query of the Zoology database shows that they are:
mysql> select flags,count(*), filter from AnalysisStage010 where psf_inst_flux_sig/psf_inst_flux > 0.05 group by flags, filter;
+-----------+----------+--------+
| flags     | count(*) | filter |
+-----------+----------+--------+
| 169869313 |    30823 | g      |
| 169869313 |     7498 | i      |
| 169869313 |     7033 | r      |
| 169869313 |     3949 | y      |
| 169869313 |     4856 | z      |
| 169869441 |       54 | g      |
| 169869441 |       39 | i      |
| 169869441 |       43 | r      |
| 169869441 |        3 | y      |
| 169869441 |       25 | z      |
| 169869569 |        1 | i      |
| 169869577 |        2 | y      |
| 169869697 |        1 | i      |
| 203423749 |        2 | i      |
| 203423749 |        1 | r      |
| 203423749 |        2 | y      |
| 203423749 |        1 | z      |
| 203423877 |        1 | y      |
| 236978181 |        4 | g      |
| 236978181 |        8 | i      |
| 236978181 |        3 | r      |
| 236978181 |        2 | y      |
| 236978181 |        6 | z      |
+-----------+----------+--------+
There are more false detections in g than in the other bands. These are the histograms for inst_flux_sig/inst_flux for different filters. The filter g has a different shaped histogram than the other 4 filters.


Applying same cuts to 'true' detections
| Subset | Total | Total after flag cuts | Total after flux cut |
| False positives | 397,521 | 56,558 (14%) | |
| True positives | 917,726 | 324,135 (35%) |
Conclusions
- By rejecting detections with flagged errors, the original total of 400,000 is reduced to 56,000 - a reduction of 86%
- By rejecting detections with an error in flux greater than 5%, the remaining total of 56,000 comes down to 2000 - a reduction of 96%
- This is a total reduction of around 99%
Attachments (10)
- ds9.jpg (342.2 KB ) - added by 15 years ago.
- sas_false_det_hist-0.png (17.6 KB ) - added by 15 years ago.
- sas_false_det_hist-1.png (18.6 KB ) - added by 15 years ago.
- sas_false_det_filter_hist-0.png (19.8 KB ) - added by 15 years ago.
- sas_false_det_filter_hist-1.png (17.9 KB ) - added by 15 years ago.
- sas_false_det_filter_hist-2.png (18.3 KB ) - added by 15 years ago.
- sas_false_det_filter_hist-3.png (17.3 KB ) - added by 15 years ago.
- sas_false_det_filter_hist-4.png (17.0 KB ) - added by 15 years ago.
- sas_true_det_hist-1.png (18.1 KB ) - added by 15 years ago.
- sas_true_det_hist-0.png (15.3 KB ) - added by 15 years ago.
Download all attachments as: .zip