| Version 3 (modified by , 15 years ago) ( diff ) |
|---|
Do we see false detections on the MD fields? Do we get funny problems with the histogram plots like we do with SAS?
Viewing the Detections
(click on the images to see bigger version)
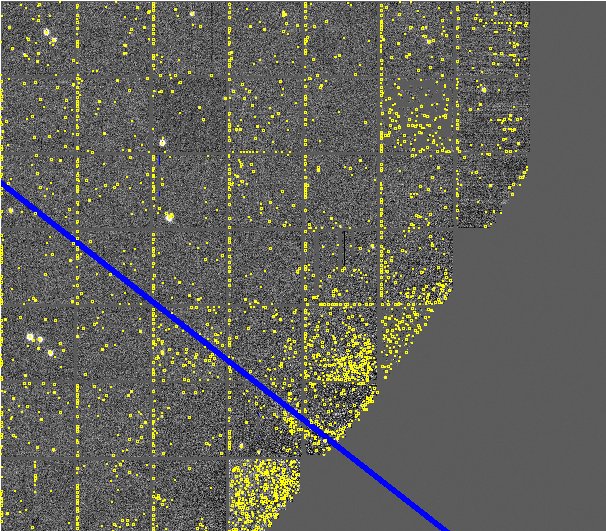
XY27 is the same chip that I used before for investigating false detections, here it is for this image:

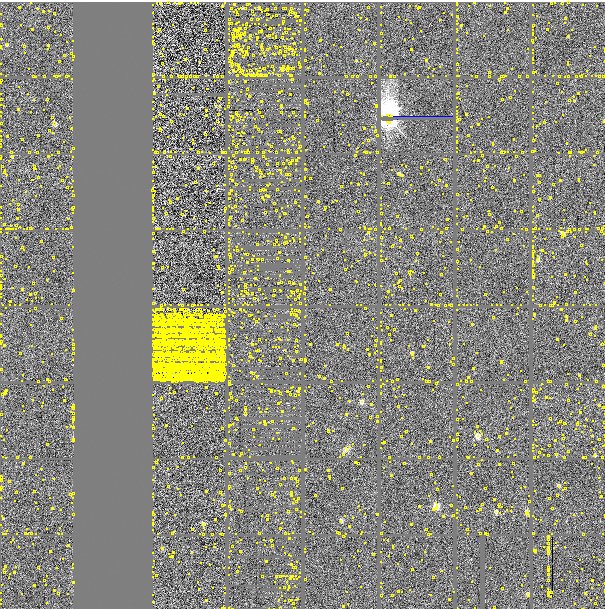
XY06

XY14

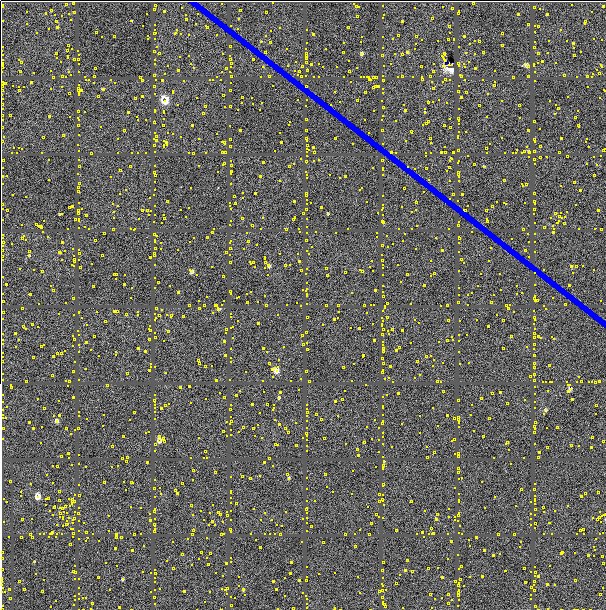
XY25

The distribution of the false detections appears a bit different for this MD field - previously, there would be entire cells that were just bad. This doesn't seem to happen like it did for the SAS footprint.
Histograms
(click on the images to make bigger)
This is a zoom of XY27 in ds9. The numbers correspond to the cells that I investigate down below. Some of these cells had a lot of streakies/and/or/false detections for SAS footprint, but it isn't so bad for this field.

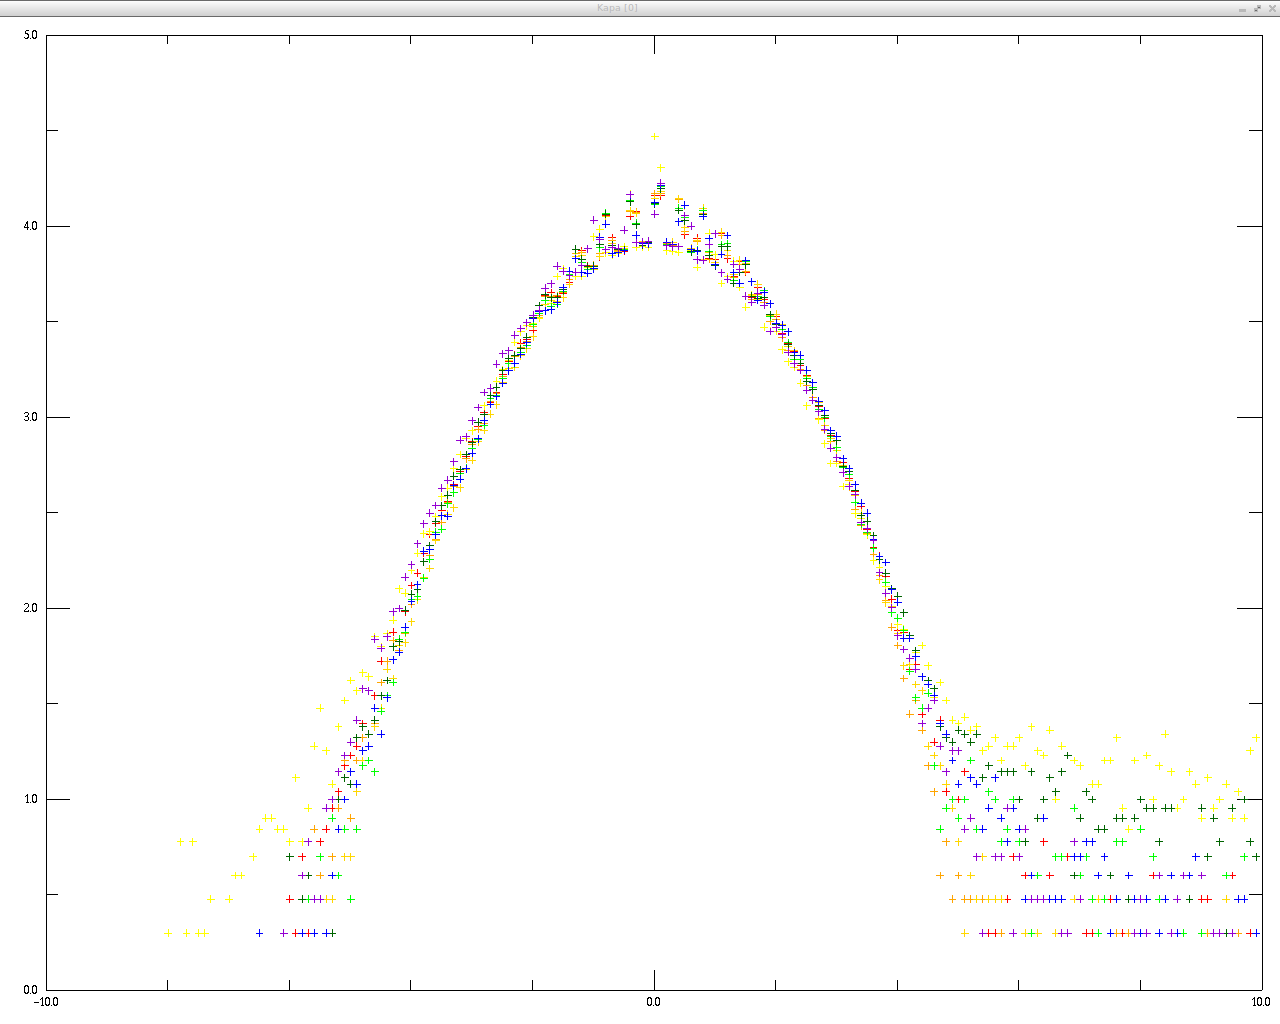
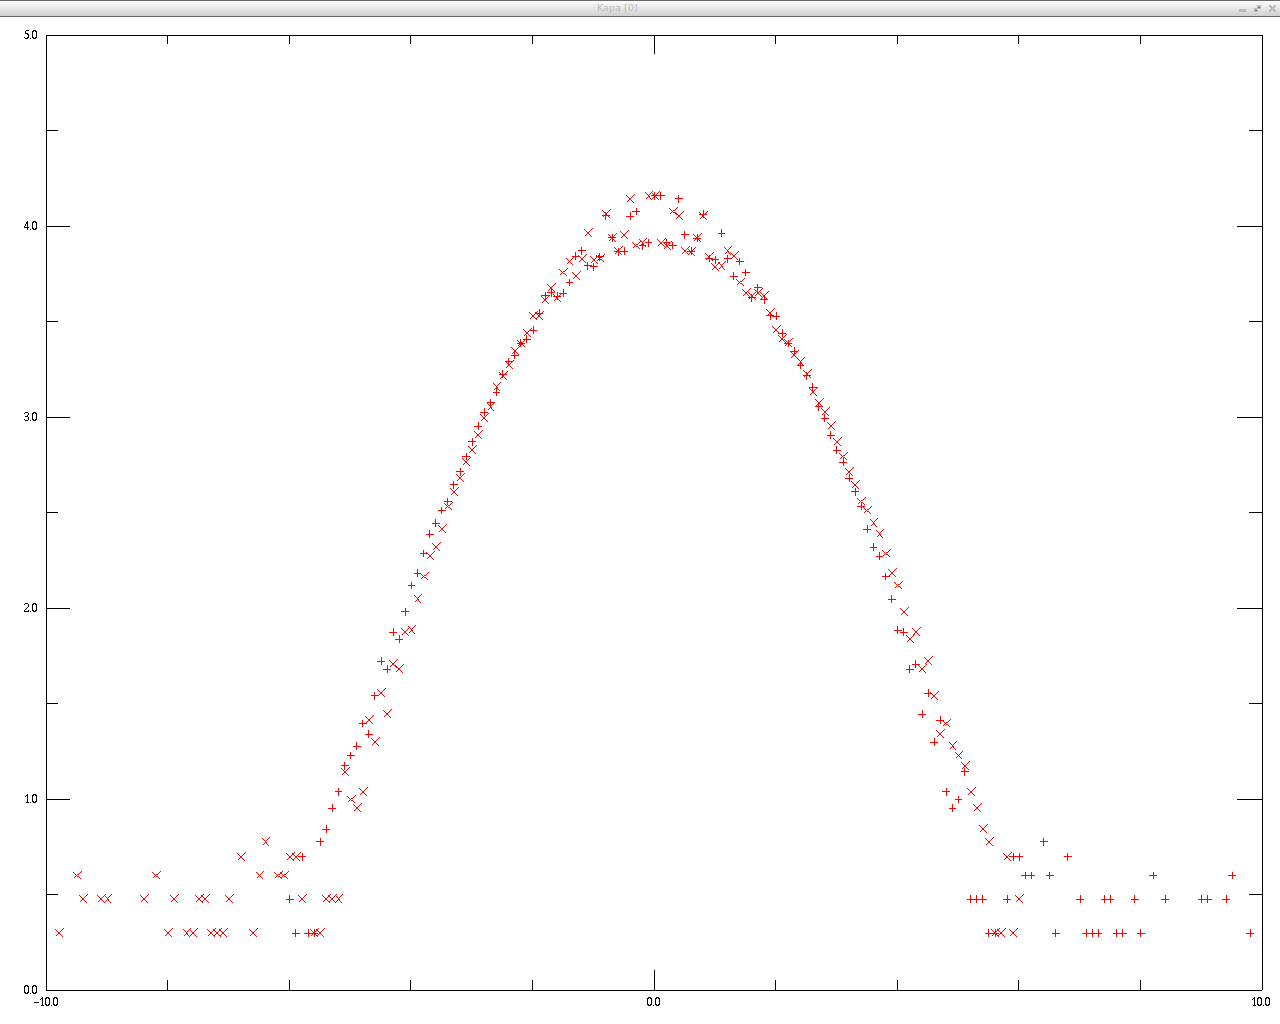
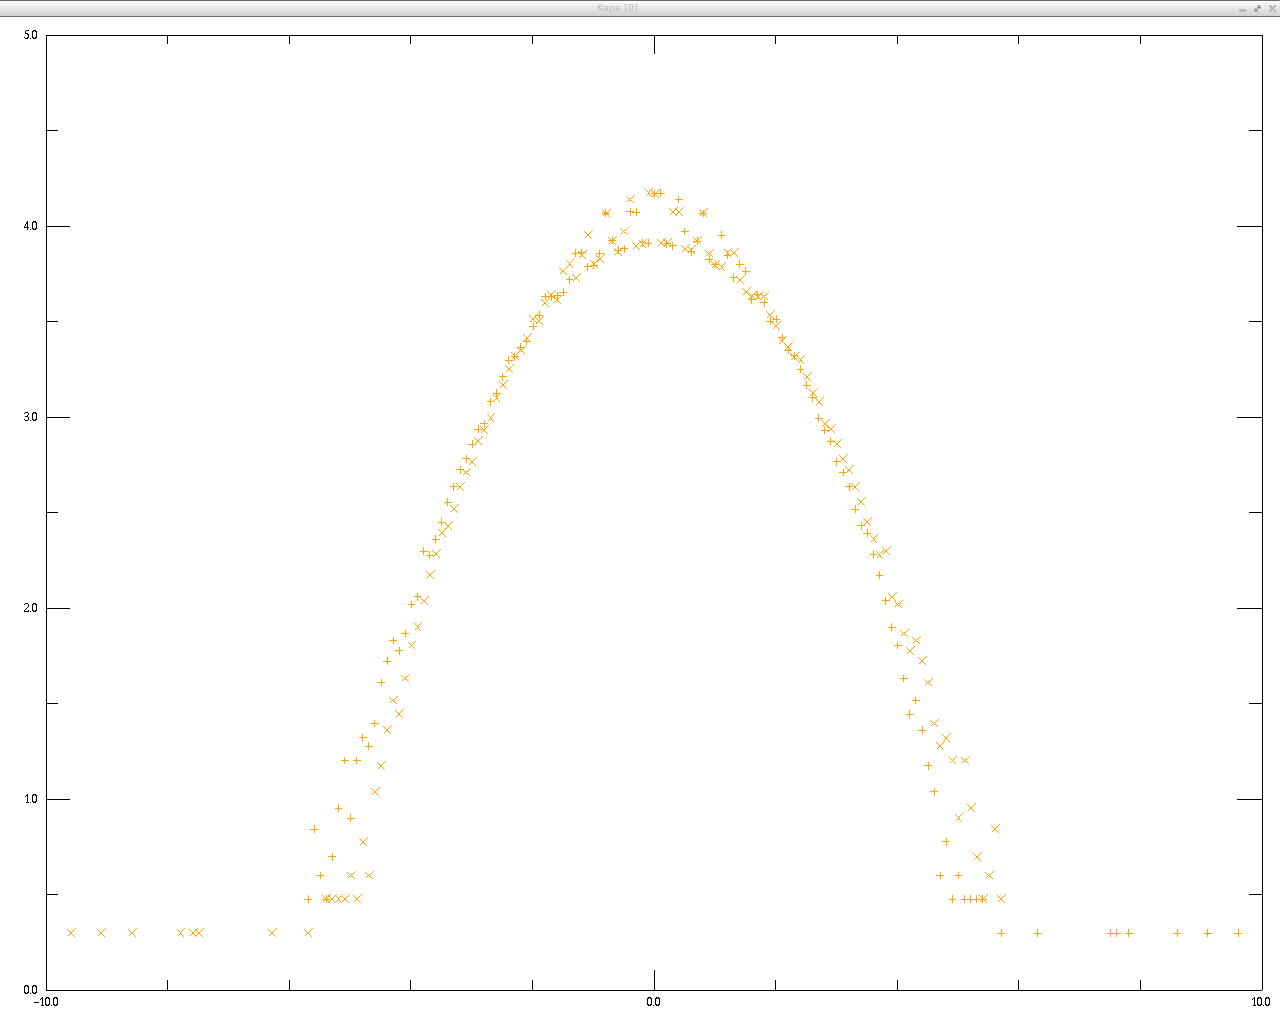
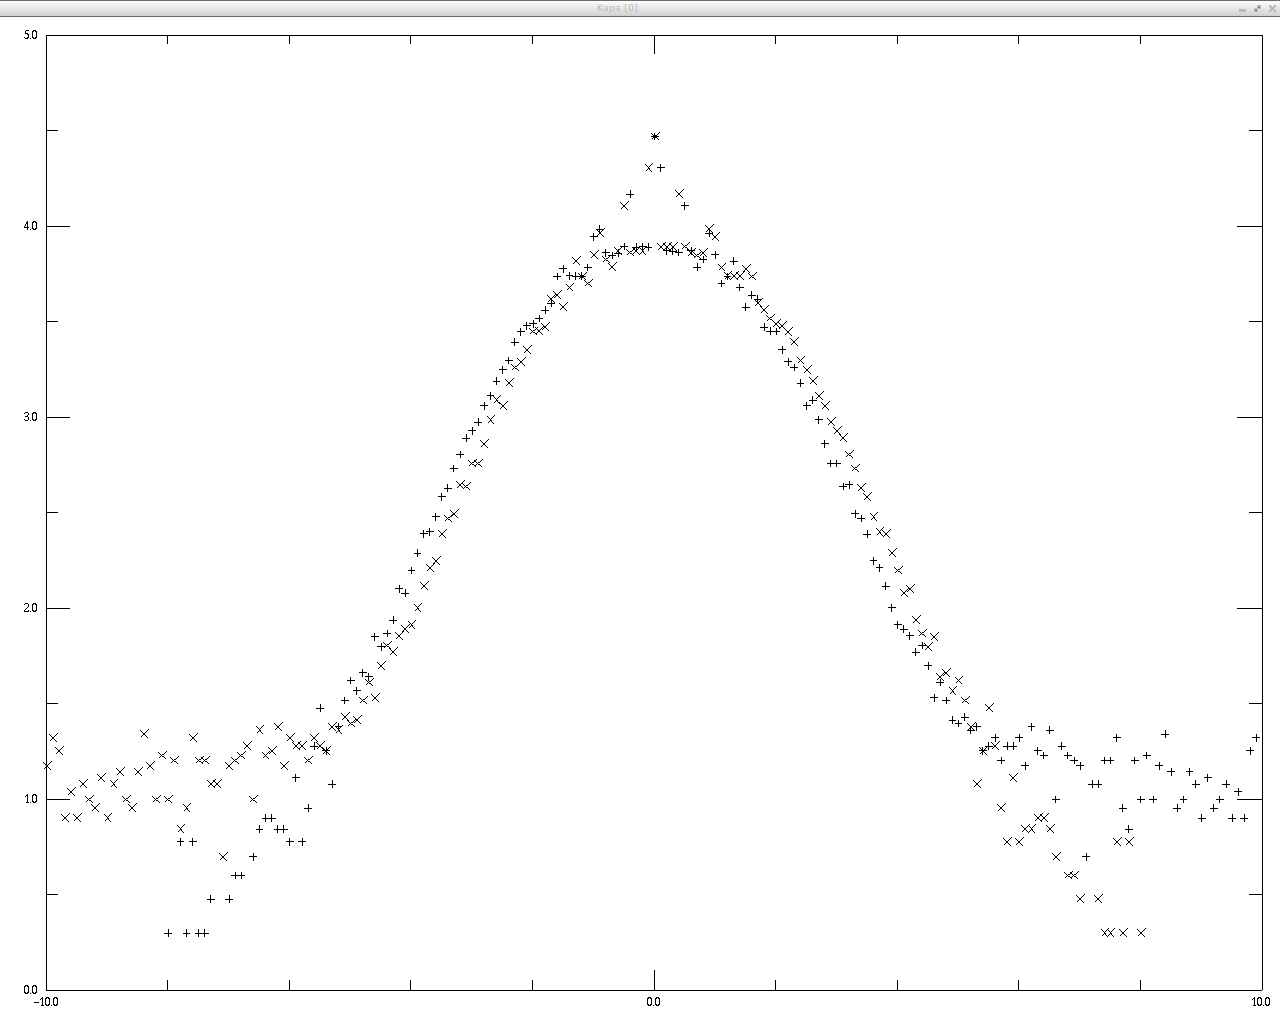
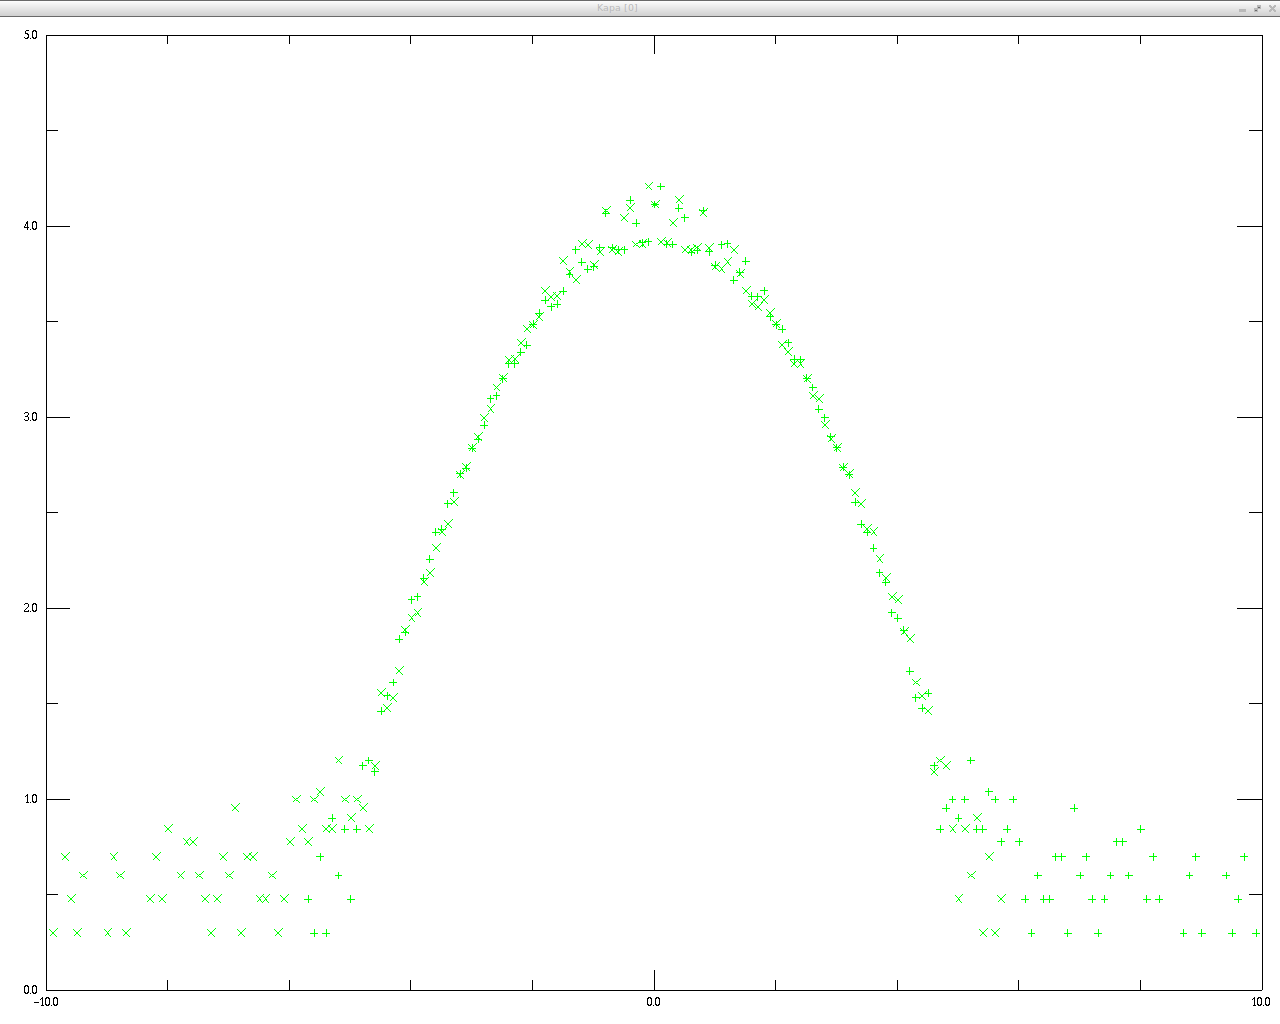
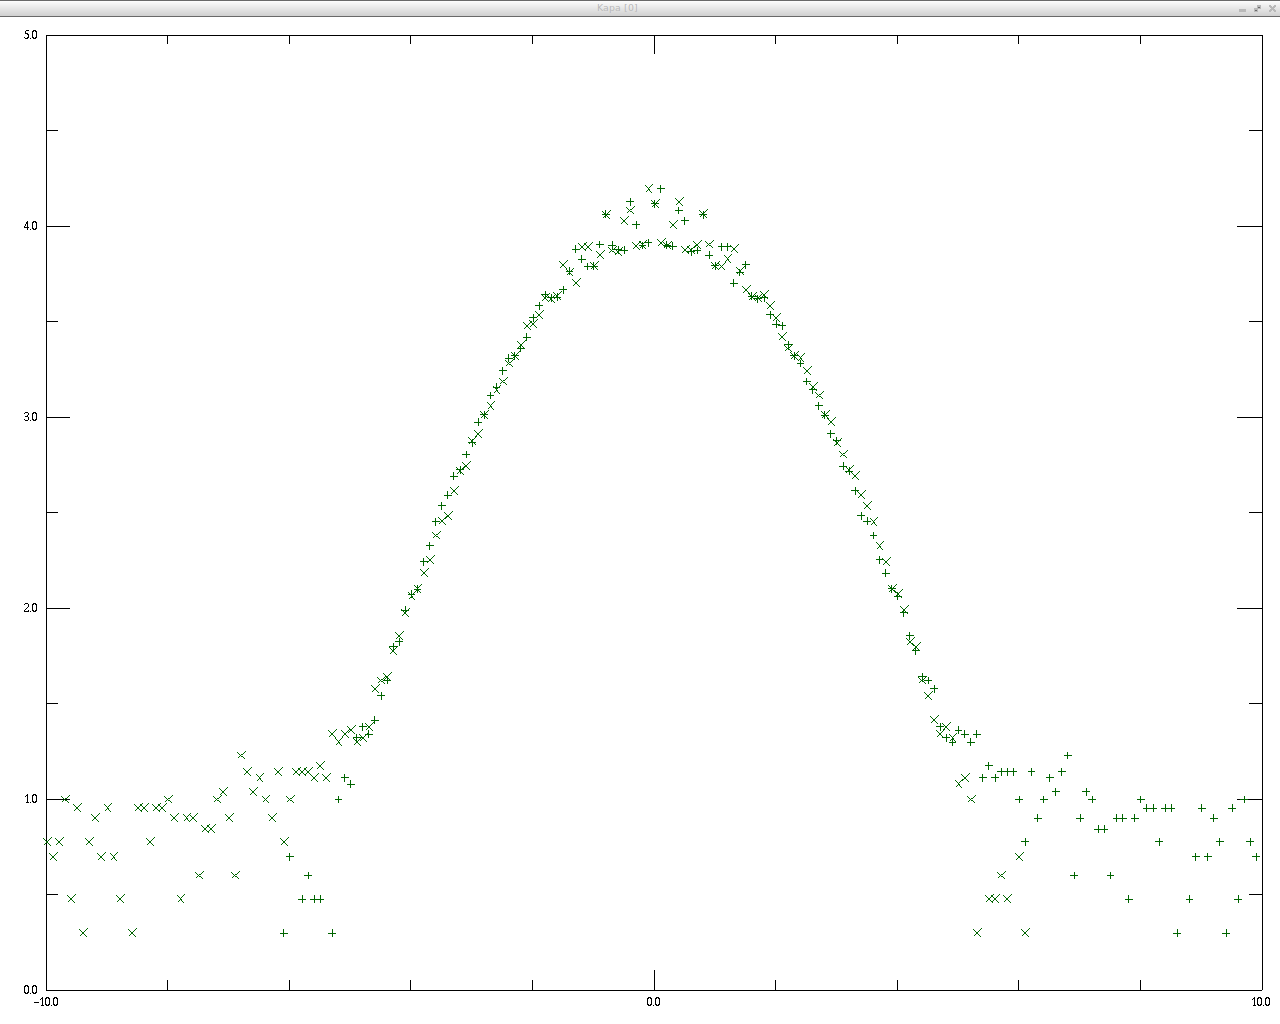
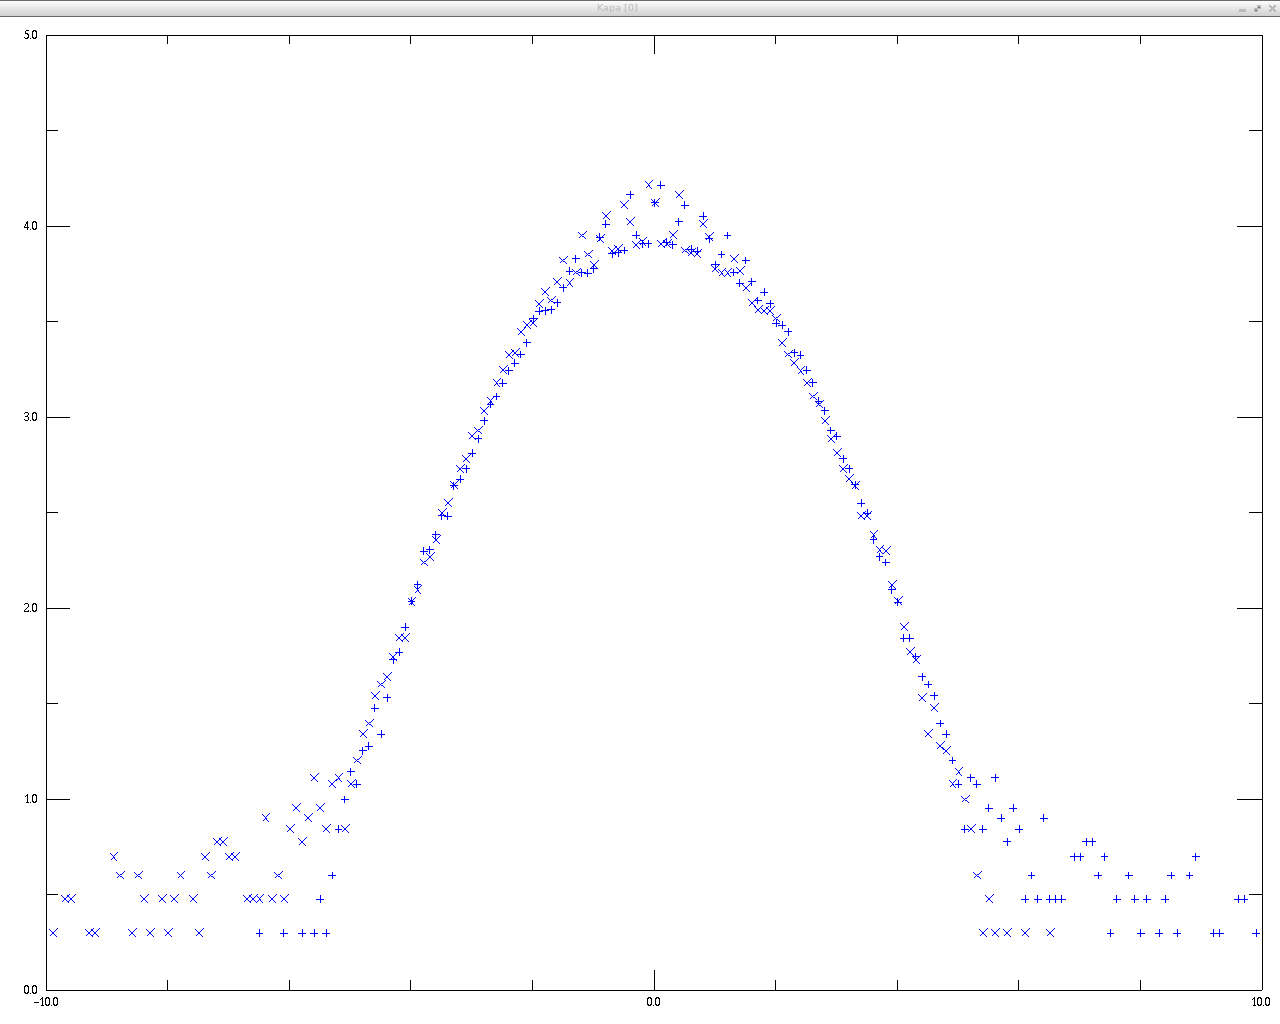
I plotted a histogram of pixel/sqrt(variance) for each of the cells. The colors are as follows:
- 1 = red
- 2 = orange
- 3 = gold
- 4 = yellow
- 5 = green
- 6 = darkgreen
- 7 = blue
- 8 = violet

This already looks a lot different than what was seen for SAS footprint.
Plotting each of the cells separately and plotting the same with the x axis flipped shows that it's way more symmetric than for SAS:
- 1
- 2
- 3

- 4
- 5
- 6
- 7
- 8
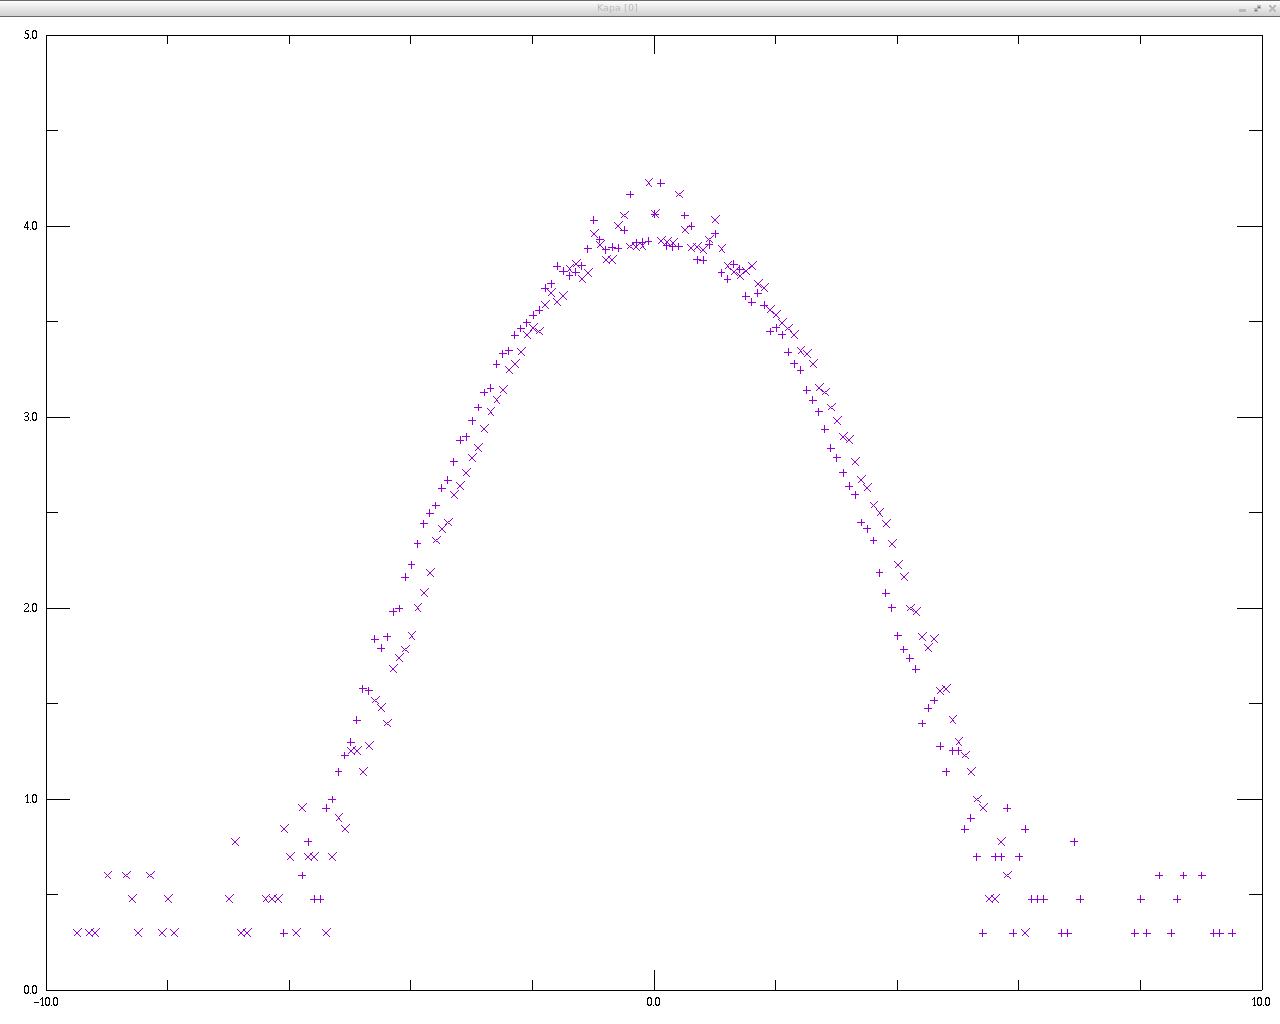


All of these plots are for the single chip stage. I am working on doing similar investigations for the stack stage.
Attachments (14)
- XY27.jpg (122.6 KB ) - added by 15 years ago.
- xy06.jpg (139.9 KB ) - added by 15 years ago.
- xy14.jpg (198.4 KB ) - added by 15 years ago.
- xy25.jpg (213.9 KB ) - added by 15 years ago.
- allofthem.png (22.8 KB ) - added by 15 years ago.
- 1.png (14.1 KB ) - added by 15 years ago.
- 2.png (13.7 KB ) - added by 15 years ago.
- 3.png (13.8 KB ) - added by 15 years ago.
- 4.png (15.7 KB ) - added by 15 years ago.
- 5.png (14.2 KB ) - added by 15 years ago.
- 6.png (15.1 KB ) - added by 15 years ago.
- 7.png (14.2 KB ) - added by 15 years ago.
- 8.png (14.5 KB ) - added by 15 years ago.
- ds9.zoom.label.png (1.0 MB ) - added by 15 years ago.
Download all attachments as: .zip