| Version 17 (modified by , 13 years ago) ( diff ) |
|---|
2013-06-03
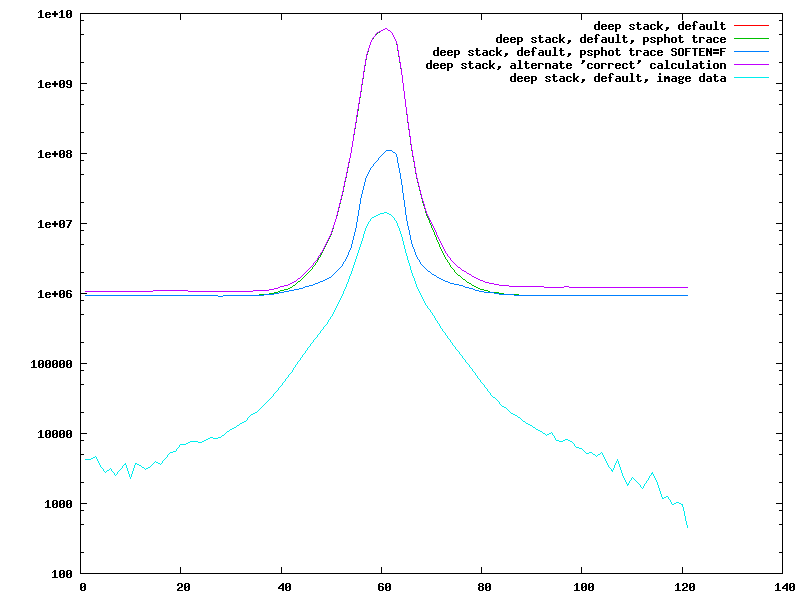
Following up on last week's study, I took a cut of one of the very bright stars in the stack and a warp. My assumption was that the image and the variance would have effectively the same profile shape. However, these plots seem to indicate that this is not the case for the stack, which has a variance profile that is significantly narrower than the image profile. I suspect this is a contributing factor to the S/N saturation issue. In the plot shown, I've somewhat arbitrarily scaled the image values to match at the peaks.

2013-05-30
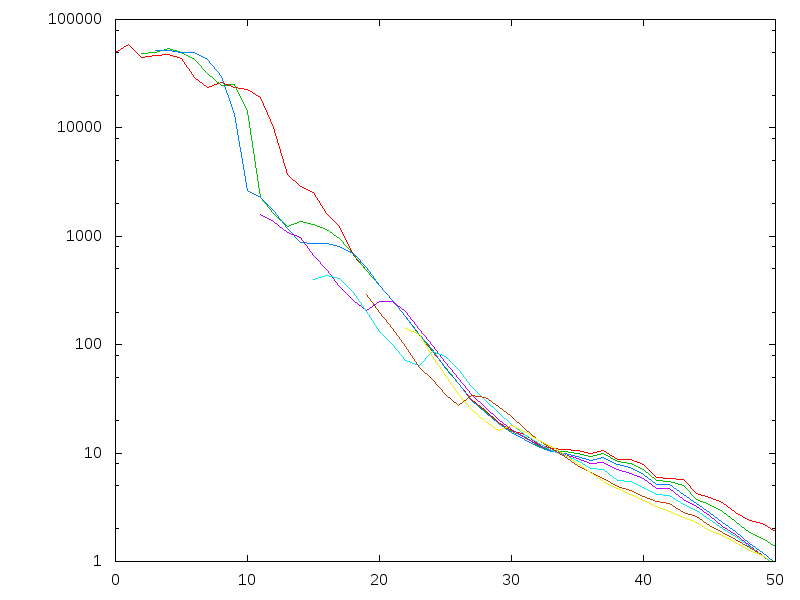
Gene suggested that the cupping may be an issue having to do with the S/N of the stack saturating to some value. To check this, I identified the four stars used earlier, added an additional star that appeared to have the core saturated, and then added four extra stars that probe a range of fainter magnitudes. The following table shows the peak values in the S2 image, the variance image, and the S2/V S/n image for these stars. The plot shows that as a function of the detection signal to noise (1 / PSF_INST_MAG_ERR), the stacks do seem to saturate at a S/N value lower than would be predicted based on the S/N values from the warp and chip image.

| Star | ra | dec | SMF PSF_INST_MAG | SMF PSF_INST_MAG_ERR | Stack S0 | N0 | S/N0 | Warp S0 | N0 | S/N0 | Chip S0 | N0 | S/N0 |
| 1 | 333.73409 | 0.56632581 | -15.4686 | 0.001778 | 2.716e+14 | 6.894e+09 | 39402.6 | 2.116e+08 | 10230.8 | 20689 | 9.93286e+07 | 9471.12 | 10487.5 |
| 2 | 333.72805 | 0.56924212 | -9.29806 | 0.0448245 | 1.252e+10 | 1.407e+06 | 8900.74 | 3.327e+08 | 650.148 | 51.1792 | 58466.8 | 1091.6 | 53.5594 |
| 3 | 333.71235 | 0.59021285 | -14.088 | 0.00188379 | 3.167e+13 | 7.998e+08 | 39603.6 | 1.696e+08 | 8878.07 | 19106.1 | 2.59828e+07 | 5320.07 | 4883.91 |
| 4 | 333.74888 | 0.56847913 | -13.1898 | 0.00288791 | 8.017e+12 | 2.045e+08 | 39186.8 | 2.880e+07 | 3578.65 | 8050.3 | 1.68626e+07 | 4515.84 | 3734.09 |
| 5 | 333.90368 | 0.67945141 | -15.483 | 0.0011215 | 1.951e+14 | 4.935e+09 | 39533.7 | 1.275e+09 | 25513.3 | 49980.8 | 1.30244e+09 | 31963.9 | 40747.1 |
| 6x | 333.72964 | 0.57289890 | -10.3435 | 0.0185431 | 4.285e+07 | 9.234e+05 | 46.4117 | 115.499 | -nan | -nan | 2.47367e+06 | 2225.52 | 1111.5 |
| 7x | 333.73039 | 0.57413921 | -11.2649 | 0.00943972 | 4.183e+11 | 1.220e+07 | 34264.2 | 1.250e+06 | 1479.24 | 845.369 | 1.70248e+06 | 2013.22 | 845.648 |
| 8x | 333.73333 | 0.57955372 | -12.6644 | 0.00386594 | 5.217e+12 | 1.338e+08 | 38972.5 | 1.565e+07 | 3006.52 | 5208.45 | 1.61128e+07 | 4363.48 | 3692.63 |
| 9x | 333.73048 | 0.58157309 | -7.77102 | 0.174155 | 2.120e+08 | 9.129e+05 | 232.25 | 3450.3 | 834.391 | 4.13513 | 4989.91 | 959.229 | 5.20078 |
break
| Star | Stack SN | warp SN | chip SN |
| 1 |  |  | 
|
| 2 |  |  | 
|
| 3 |  |  | 
|
| 4 |  |  | 
|
| 5 |  |  | 
|
2013-05-29
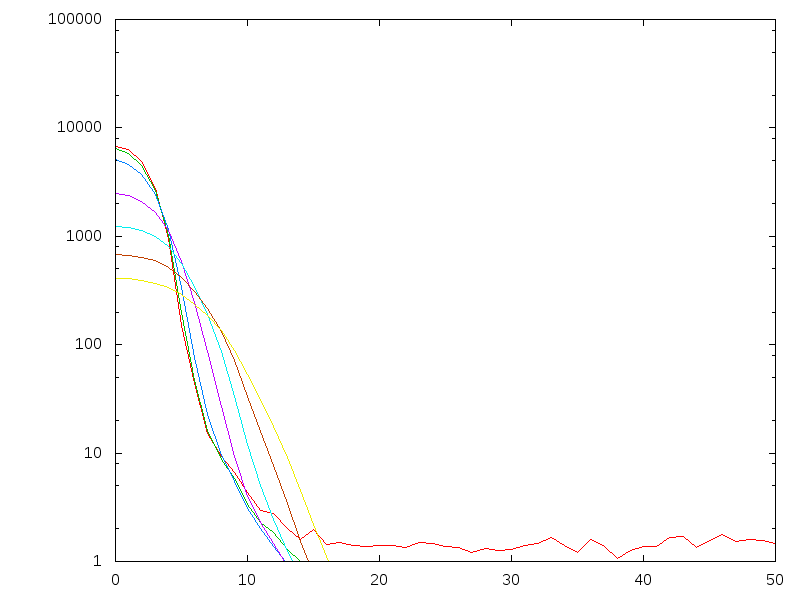
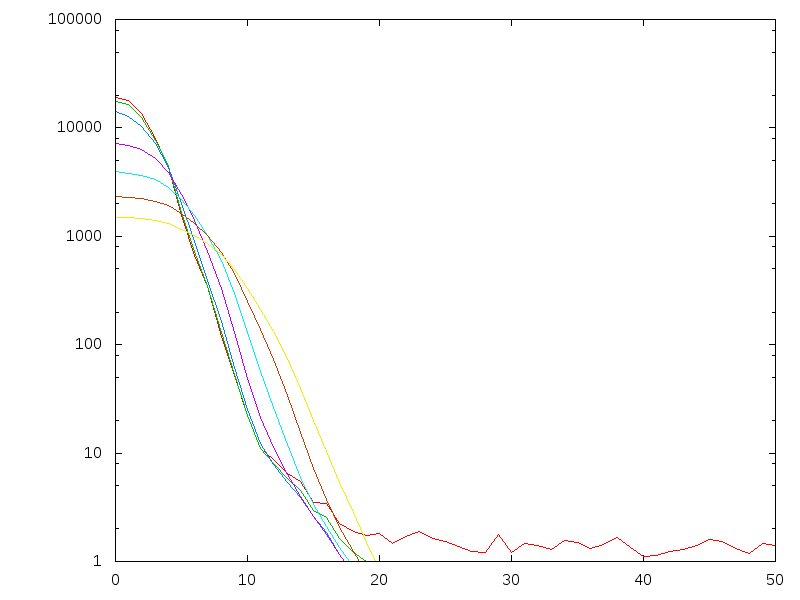
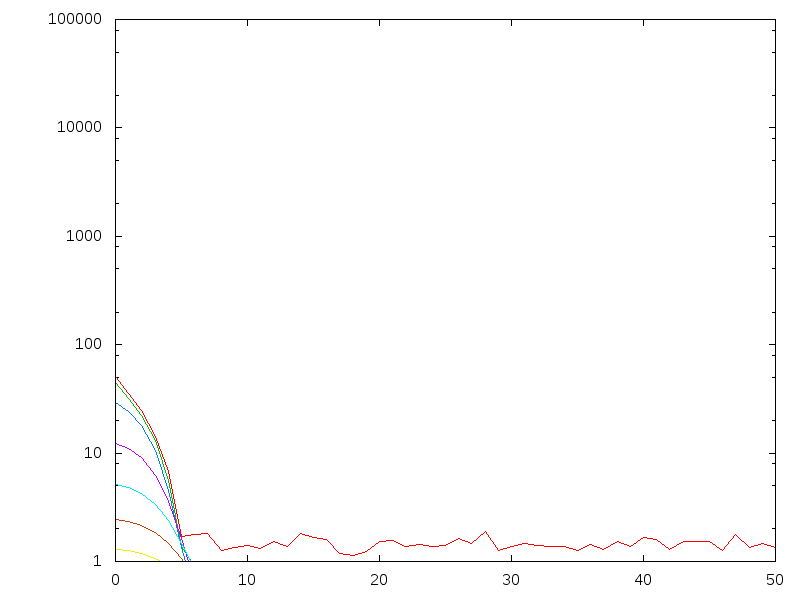
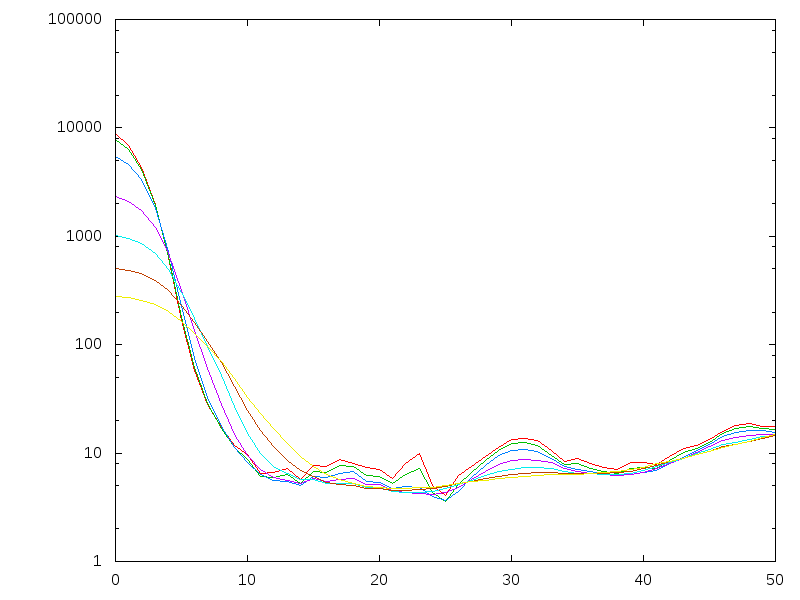
For this test, I selected a sample of stars over two orders of peak flux levels, and then convolved them with various Gaussian kernels in mana. For all lines below the colors and kernel sizes are:
| color | kernel sigma |
| red | 0.0 |
| green | 0.5 |
| blue | 1.0 |
| purple | 2.0 |
| cyan | 3.0 |
| brown | 4.0 |
| yellow | 5.0 |
I used different kernels for the variance. The first set of plots below use the variance * kern2, which is equivalent to convolving with a kernel 1/sqrt(2) times the sigma of image. This is the mathematically correct method. The second set of plots use the variance * kern, where the same kernel is used on the image as is on the variance. This is not the mathematically correct method, but probes the space of "what if we convolve the variance incorrectly".
| peak | im hwhm | var hwhm | sig_im / (sqrt(2) * sig_var) | (im*kern)2 / (var * (kern2)) | (im*kern)2 / (var * kern) | |
| star 1 | 1.64e+07 | 7.06 | 6.20 | 0.80520 |  | 
|
| star 2 | 1.12e+05 | 2.59 | 1.73 | 1.05867 |  | 
|
| star 3 | 5.63e+06 | 4.09 | 3.29 | 0.87904 |  | 
|
| star 4 | 2.83e+06 | 3.77 | 3.03 | 0.87981 |  | 
|
2013-05-09
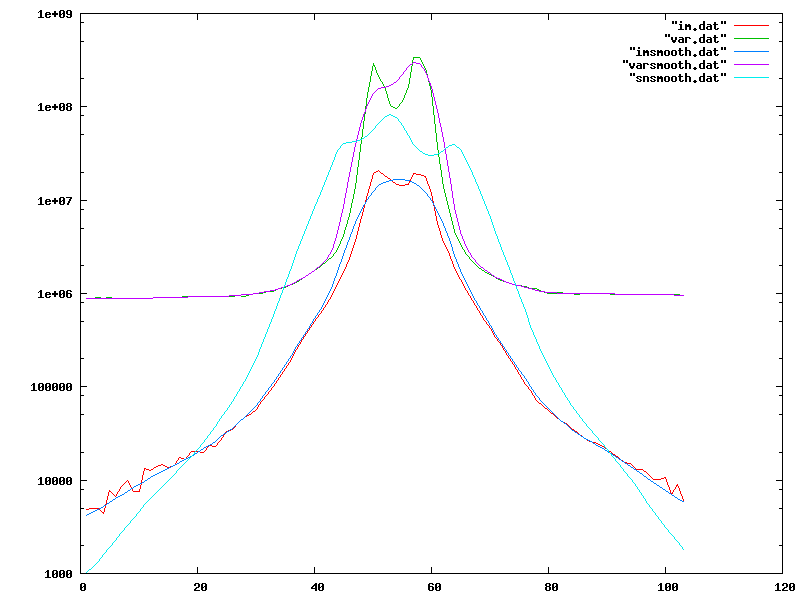
These two figures show the same image/variance/sn profiles as from 2013-05-07, but have additional lines showing these values for the unsmoothed images. The only difference between the two figures is the scaling applied for the unsmoothed SN value.


2013-05-07
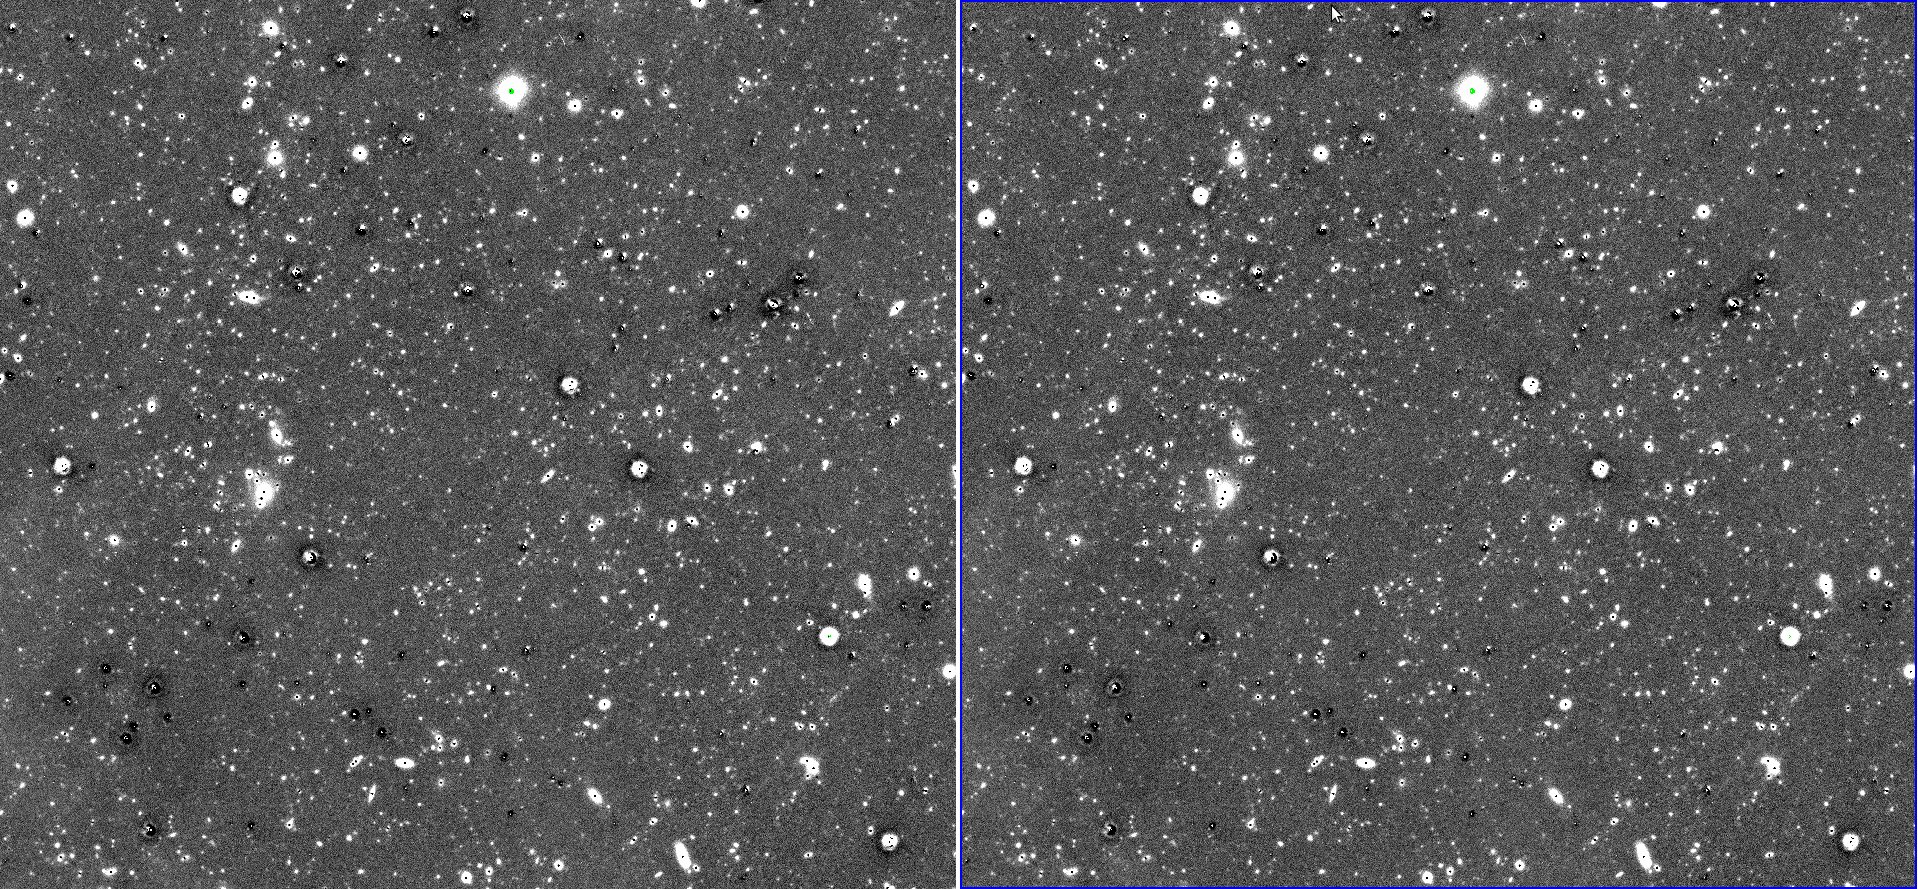
In an attempt to determine if the v2 factor in the psphotSignificanceImage calculation was necessary, I first looked at single frame detections. For a given section of an image (with many false positives due to row-to-row issues), there do not appear to be any issues with secondary peaks around bright objects. (key: red: matched detections between v2 and no-v2; blue: only found in v2; green: only found in no-v2)


However, looking at the deep stack i/055 histograms from 2013-05-01, it is clear that with v2 disabled, a new population of bright false positives arises. Overplotting matched (green) and unmatched objects (blue; although note that many are objects that were not found in SDSS, as they appear to fall on faint real sources), bright stars do seem to have adjacent false positives:

Taking a profile of the smoothed image for one of these stars shows the cupped S/N profile that leads to this issue (and that v2 was designed to fix). However, it seems that the v2 factor could be changed from 100 to 1000 to ensure that the expected S/N peak is not overly amplified.

2013-05-01
False positive histograms
I've been attempting to address the false positive rate, and believe part of the issue is with the v2 calculation in psphot. Disabling this appears to correct the worst issues in the y/027 stack. There is also a minimal change in the distribution of matched objects. The i/055 stack does not improve when v2 is disabled, so this is not likely to be a generic fix for all false positive issues.


v2 calculation
The significance image in psphot is calculated as:
(S/N)2 = (I + (I / 100)2)2 / V
where I is the smoothed image value, and V is the smoothed variance image value. Based on a standard S/N calculation in terms of I2 / V, this is equal to
(S/N)2 = (I2 / V) * (1 + 2 * (I/100) + (I / 100)2)
Attachments (36)
- sn_star_prof_i055.png (8.1 KB ) - added by 13 years ago.
- deepstack_i055.jpg (516.7 KB ) - added by 13 years ago.
- single_frame_unmatched.jpg (206.4 KB ) - added by 13 years ago.
- single_frame_matched.jpg (228.3 KB ) - added by 13 years ago.
- sn_test3.png (8.5 KB ) - added by 13 years ago.
- sn_test2.png (8.6 KB ) - added by 13 years ago.
- star4_SNa.png (8.4 KB ) - added by 13 years ago.
- star3_SNa.png (8.4 KB ) - added by 13 years ago.
- star4_SN.png (8.2 KB ) - added by 13 years ago.
- star3_SN.png (8.2 KB ) - added by 13 years ago.
- star2_SNa.png (7.7 KB ) - added by 13 years ago.
- star2_SN.png (7.6 KB ) - added by 13 years ago.
- star1_SNa.png (7.0 KB ) - added by 13 years ago.
- star1_SN.png (6.7 KB ) - added by 13 years ago.
- chip45_star5_SN.png (8.0 KB ) - added by 13 years ago.
- chip35_star4_SN.png (6.4 KB ) - added by 13 years ago.
- chip35_star3_SN.png (6.8 KB ) - added by 13 years ago.
- chip35_star2_SN.png (5.5 KB ) - added by 13 years ago.
- chip35_star1_SN.png (7.4 KB ) - added by 13 years ago.
- warp_star5_SN.png (8.0 KB ) - added by 13 years ago.
- warp_star4_SN.png (6.6 KB ) - added by 13 years ago.
- warp_star3_SN.png (6.8 KB ) - added by 13 years ago.
- warp_star2_SN.png (5.4 KB ) - added by 13 years ago.
- warp_star1_SN.png (7.0 KB ) - added by 13 years ago.
- stack_star5_SN.png (5.9 KB ) - added by 13 years ago.
- stack_star4_SN.png (8.2 KB ) - added by 13 years ago.
- stack_star3_SN.png (8.2 KB ) - added by 13 years ago.
- stack_star2_SN.png (7.6 KB ) - added by 13 years ago.
- stack_star1_SN.png (6.7 KB ) - added by 13 years ago.
- saturation.png (6.0 KB ) - added by 13 years ago.
- star_width.png (13.9 KB ) - added by 13 years ago.
- sn.png (8.5 KB ) - added by 13 years ago.
- variances.png (7.5 KB ) - added by 13 years ago.
- sat_stars.png (7.8 KB ) - added by 13 years ago.
- residuals.jpg (779.7 KB ) - added by 13 years ago.
- pr26_issue.jpg (974.1 KB ) - added by 13 years ago.