| Version 1 (modified by , 13 years ago) ( diff ) |
|---|
2013-10-25
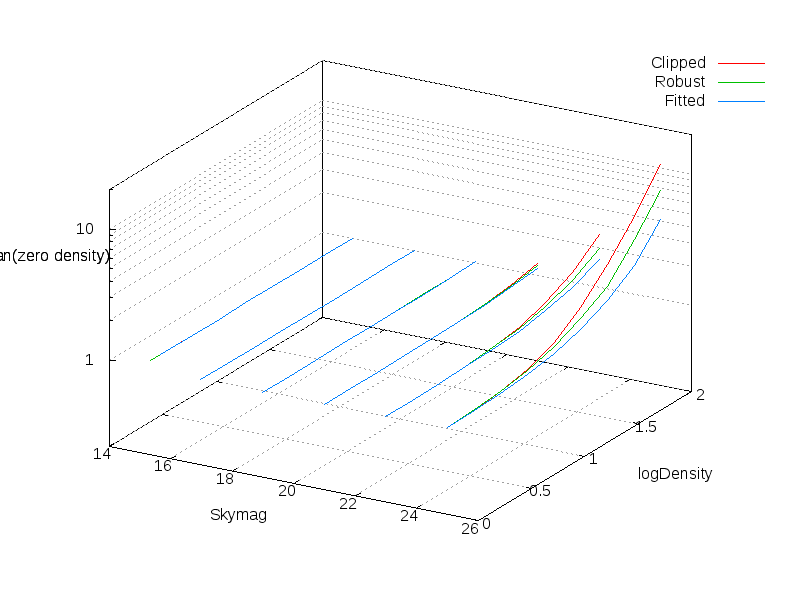
To test the behavior of the recent psStats changes on less simple distributions, a series of simulated images were constructed in ppSim. All images were constructed such that all stars are generated with the same magnitudes and positions across runs. To explore a range of astronomical situations, simulations were constructed over a grid in the STARS.DENSITY and SKY.MAGS parameters. The SKY.MAGS value was sampled every two magnitudes between 15 and 25. The STARS.DENSITY was sampled in log10 space, with samples at log(density) = (-3,-2,-1,0,0.25,0.5,0.75,1.0,1.25,1.5,1.75,2). Densities higher than this became unreasonably long to run. The remaining ppSim options used were:
ppSim -type OBJECT -filter r -skymags $sky -ra 270.70 -dec -23.70 -pa 0.0 -Df PSASTRO:DVO.GETSTAR.MAX.RHO 50000.0 -exptime 10.0 -D PSF.MODEL PS_MODEL_GAUSS -Df STARS.DENSITY $density -Db STARS.REAL F -camera SIMTEST -recipe PPSIM STACKTEST.RUN -D PSASTRO:PSASTRO.CATDIR catdir.ref -Db STARS.FAKE T -Db MATCH.DENSITY F -Db PSF.CONVOLVE T $outname -seeing 1.0 -seed 12345
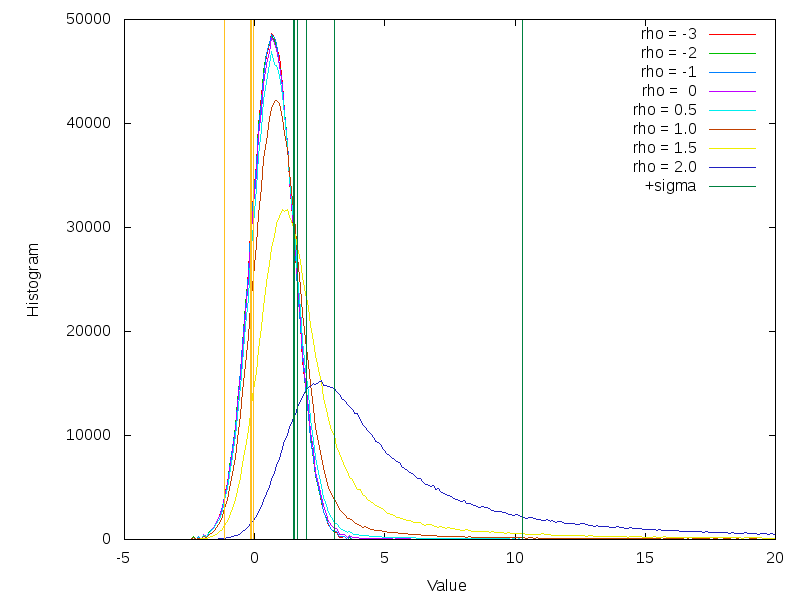
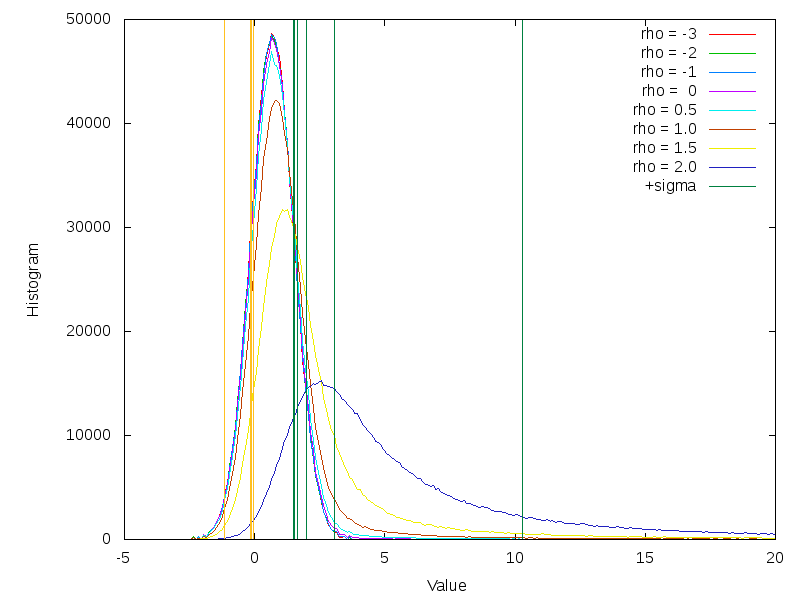
The first table of plots shows the comparison between the current operations tag and the trunk psStats values for the robust and fitted mean and sigma. For the skymag=25 case, the histograms of a selected set of stellar densities are plotted, along with vertical lines denoting the locations of the means and +/- sigma values.
| Statistic | Means | Sigma |
| tag robust |  | 
|
| trunk robust |  | 
|
| tag fitted |  | 
|
| trunk robust |  | 
|
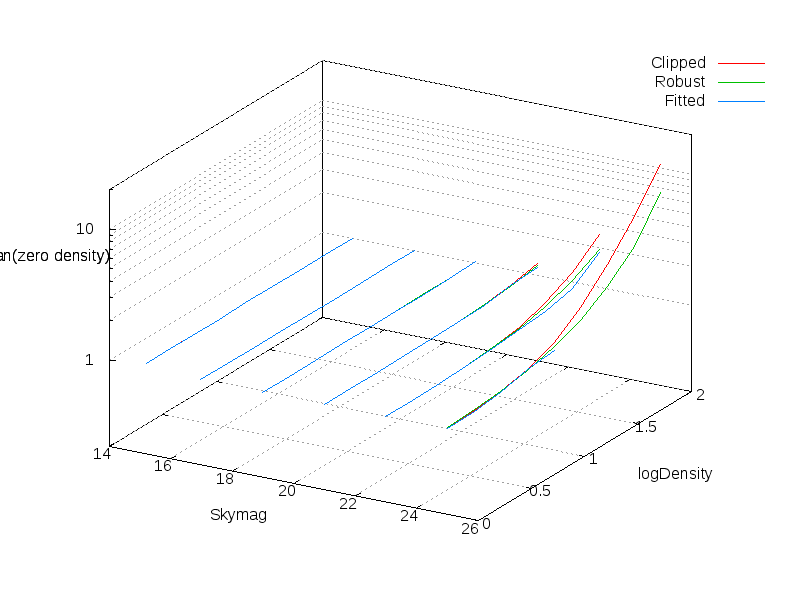
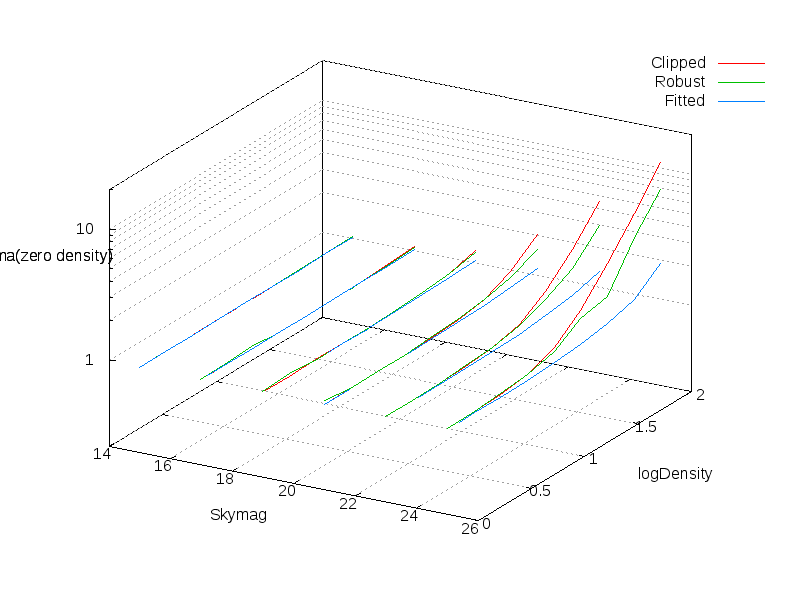
The second table shows the measured ratios of the mean and sigma values to those values for the density=-3 case (representing "truth").
| Statistic | Means | Sigma |
| Tag |  | 
|
| Trunk |  | 
|
Attachments (13)
- trunk_sky25_robust_sigma.png (9.7 KB ) - added by 13 years ago.
- tag_mean_comparisons.png (11.5 KB ) - added by 13 years ago.
- tag_sigma_comparisons.png (12.1 KB ) - added by 13 years ago.
- trunk_sky25_robust_sigma.2.png (9.7 KB ) - added by 13 years ago.
- trunk_sky25_robust_mean.png (9.3 KB ) - added by 13 years ago.
- trunk_sigma_comparisons.png (12.5 KB ) - added by 13 years ago.
- trunk_mean_comparisons.png (11.5 KB ) - added by 13 years ago.
- tag_sky25_robust_mean.png (9.2 KB ) - added by 13 years ago.
- tag_sky25_fitted_mean.png (8.8 KB ) - added by 13 years ago.
- tag_sky25_robust_sigma.png (9.2 KB ) - added by 13 years ago.
- tag_sky25_fitted_sigma.png (8.6 KB ) - added by 13 years ago.
- trunk_sky25_fitted_sigma.png (8.9 KB ) - added by 13 years ago.
- trunk_sky25_fitted_mean.png (9.1 KB ) - added by 13 years ago.
Download all attachments as: .zip