| Version 9 (modified by , 13 years ago) ( diff ) |
|---|
psphot Extended Source Fit Testing
This page discusses some experiments where we ran psphot on simulated images to test recent improvements to the psphot extended source fitting.
The 40 simulated images were provided last year by Peter Draper for use in testing the psphot kron radius and magnitude code. They were constructed using E Bertin's SkyMaker program.
The objects of interest are simulated galaxies which are described by the following parameters
  - x y   centre of object in pixels
  - mag   total magnitude
  - bt    build/disk ratio
  - br    bulge effective radii (half light arcsec)
  - bi    bulge inclination (always 1 in this sample)
  - ba    bulge position angle
  - dl    disk scale length (arcsec)
  - di    disk inclincation (always 1 in this sample)
  - da    disk position angle
  - z     redshift
  - ht    hubble type  (10 for pure disks, -6 for pure bulges)
These images were run though psphot using the STACKPHOT recipe. The parameters for the set of sources psphot selected for extended source fitting were matched by coordinates to the list of simulated galaxies. In the following sections we examine the fits for the 3 different models. We concentrate mostly on the simple galaxy models, pure disks (exponential profile) and and pure bulges (de Vaucouleur 1/4 profile).
Sersic Model
    I(r) = I(0) exp[ -k * R ** (1 / m) ]

psphot extended source parameters meausred
   EXT_INST_MAG
   EXT_WIDTH_MAJ
   EXT_WIDTH_MIN
   EXT_THETA
   EXT_PAR_07       (0.5 / m)
Since all of the simulated galaxes in this sample have bulge inclination == 1 and disk inclination == 1, the major an minor axes should be equal and the angle will unmeasurable due to noise.
Sersic Fit Magnitudes
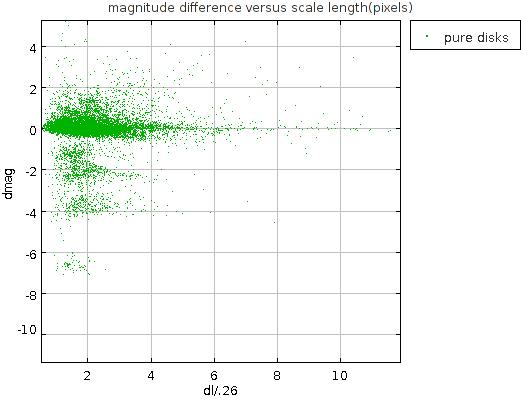
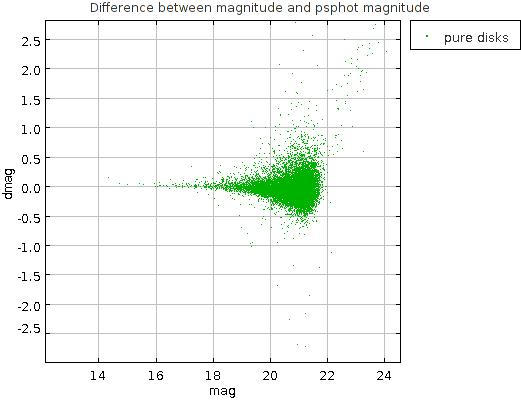
The difference between the simulated galaxys' magnitudes and the sersic fit magnitudes are shown in the following plot. 91% of the sources are contained in the band near zero. The reason for the other bands needs to be investigated.

If we consider only the pure bulge sources the fits are better. psphot under estimates the flux somewhat. If we look at pure disks we see the banding.


Sersic Index
If we look at the sersic index for all galaxies we get the following histogram. The hisogram on the right shows the counts for pure disks and bulges. We see that the fits for bulges are clustered around 4 as expected while disks mostly have values near 1.


Radii
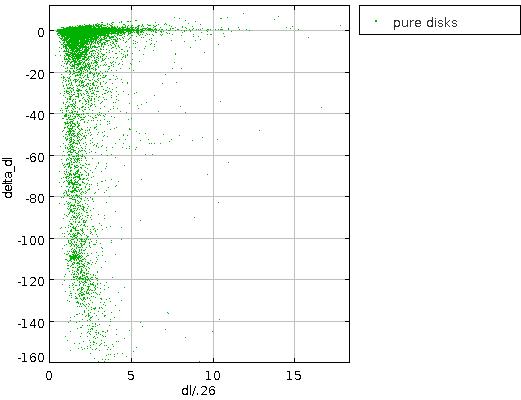
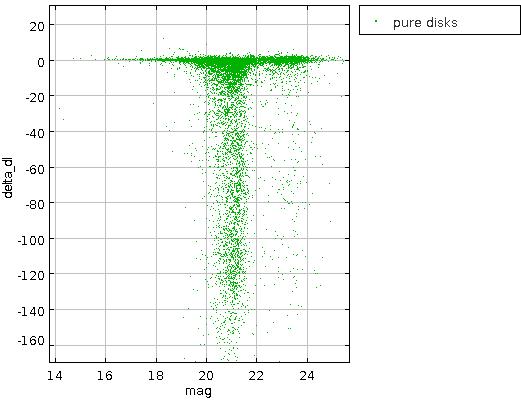
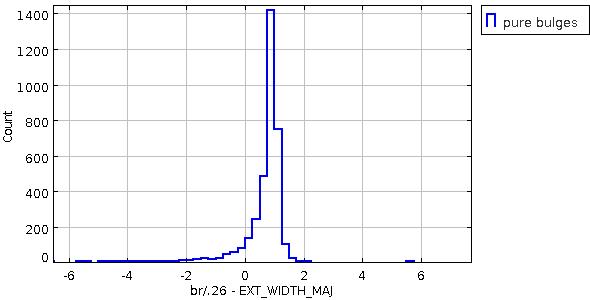
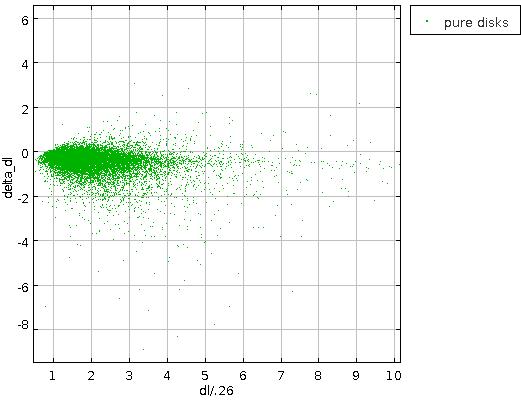
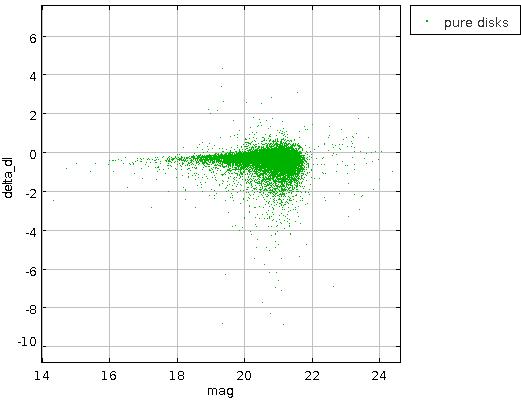
If we compare the measured widths with the source sizes we see effects that are not understood.
disks
The following plots compare the measured semi-major axis with the disk scale length. The plot on the left shows all pure disks while the plot on the right zooms in on the linear regime. We find that the measured width is a factor of 2 larger.


bulges
Attachments (30)
-
dmag_sersic.jpg
(32.7 KB
) - added by 13 years ago.
Difference between magnitude and sersic fit magnitude all sources
- dmag_sersic_bulges.jpg (25.0 KB ) - added by 13 years ago.
- dmag_sersic_disks.jpg (27.9 KB ) - added by 13 years ago.
- disk_widths.2.jpg (27.0 KB ) - added by 13 years ago.
- sersic_index_pure.jpg (27.9 KB ) - added by 13 years ago.
- sersic_index.jpg (20.1 KB ) - added by 13 years ago.
- bulge_widths.jpg (27.4 KB ) - added by 13 years ago.
- dmag_disks_v_dl.jpg (29.4 KB ) - added by 13 years ago.
- dmag_exp.jpg (30.7 KB ) - added by 13 years ago.
- dmag_exp_disks.jpg (28.3 KB ) - added by 13 years ago.
- disk_widths_exp.jpg (26.7 KB ) - added by 13 years ago.
- bulge_widths_fixpos.jpg (30.1 KB ) - added by 13 years ago.
- dmag_dev_bulges_fixpos.jpg (26.3 KB ) - added by 13 years ago.
- disk_widths.jpg (26.9 KB ) - added by 13 years ago.
- disk_widths_zoom.jpg (42.6 KB ) - added by 13 years ago.
- ddl_v_dl_sersic.jpg (27.6 KB ) - added by 13 years ago.
- ddl_v_mag_sersic.jpg (30.8 KB ) - added by 13 years ago.
- ddl_disks_hist_sersic.jpg (22.7 KB ) - added by 13 years ago.
- br_bulges_hst_sersic.jpg (20.4 KB ) - added by 13 years ago.
- disk_widths_exp.2.jpg (26.7 KB ) - added by 13 years ago.
- disks_widths_exp.jpg (26.7 KB ) - added by 13 years ago.
- ddl_v_dl_exp.jpg (29.6 KB ) - added by 13 years ago.
- ddl_v_mag_exp.jpg (24.8 KB ) - added by 13 years ago.
- ddl_hist_exp.jpg (23.5 KB ) - added by 13 years ago.
- dmag_dev.jpg (28.6 KB ) - added by 13 years ago.
- dmag_dev_bulges.jpg (26.3 KB ) - added by 13 years ago.
- bulge_widths_dev.jpg (23.5 KB ) - added by 13 years ago.
- dr_v_br_dev.jpg (39.8 KB ) - added by 13 years ago.
- dr_v_mag_dev.jpg (34.1 KB ) - added by 13 years ago.
- dr_hist_dev.jpg (23.2 KB ) - added by 13 years ago.
Download all attachments as: .zip