| Version 15 (modified by , 13 years ago) ( diff ) |
|---|
2013-04-22
Armin's questions/points
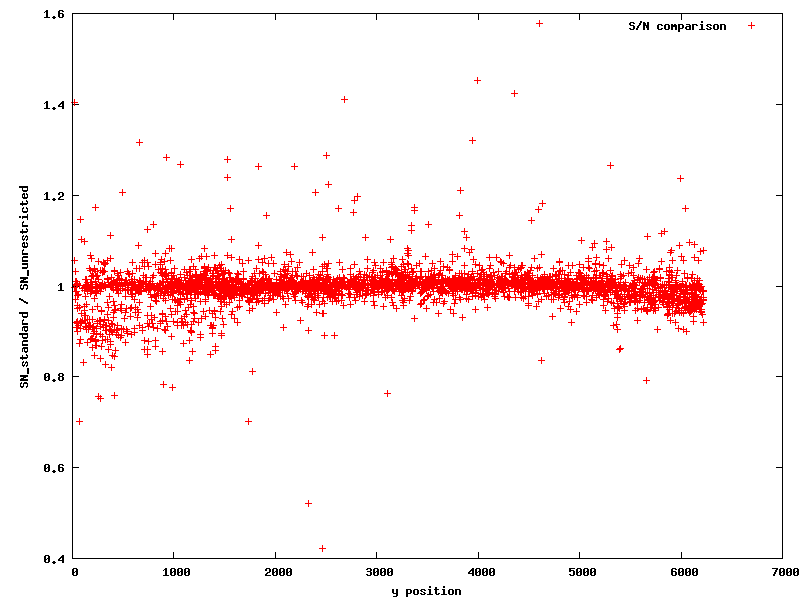
- Q1: "One good test to see if everything is propagated correctly is to check the noise"
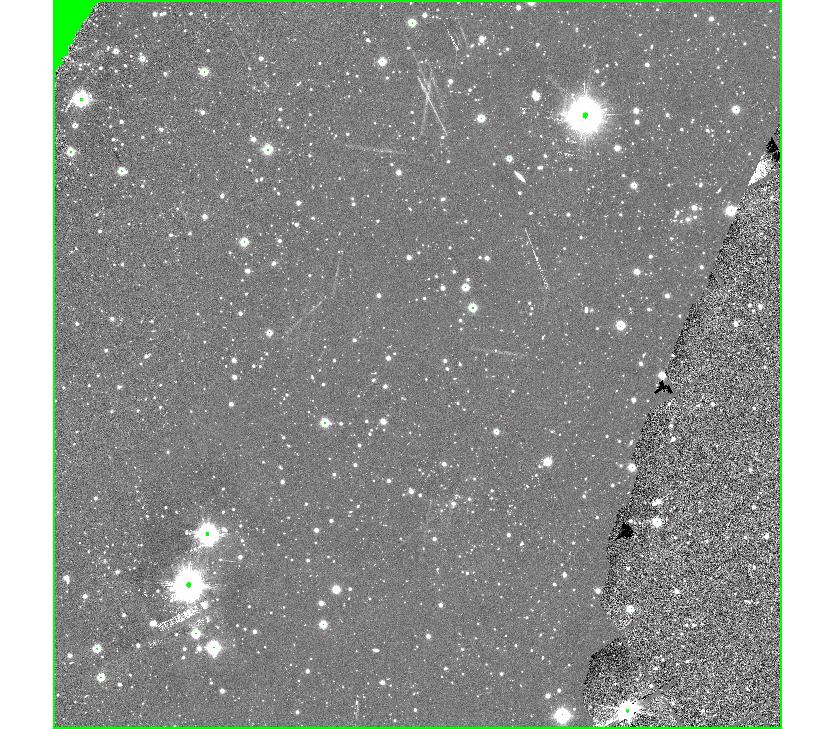
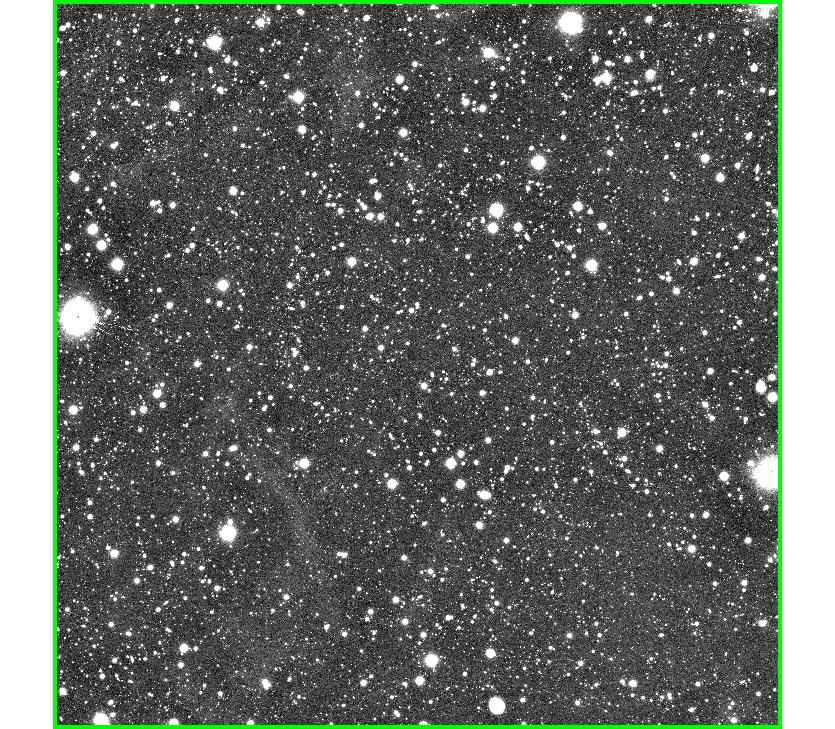
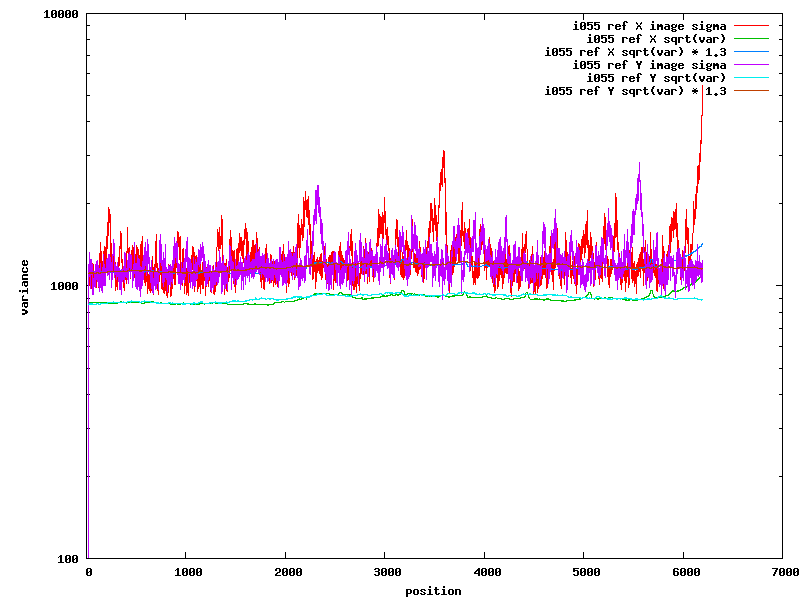
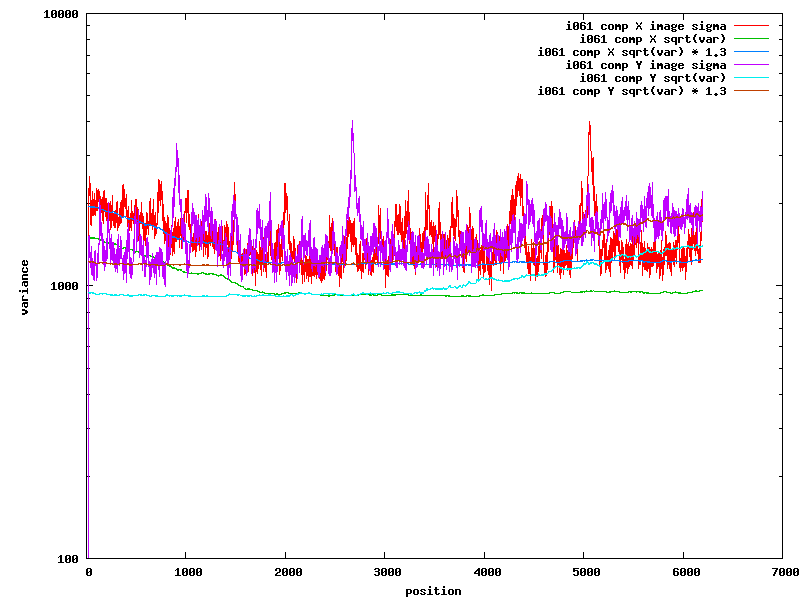
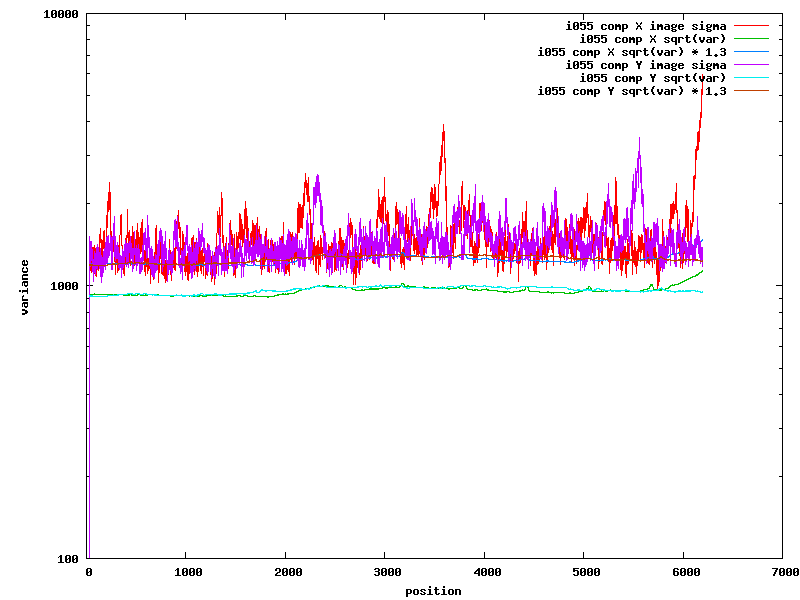
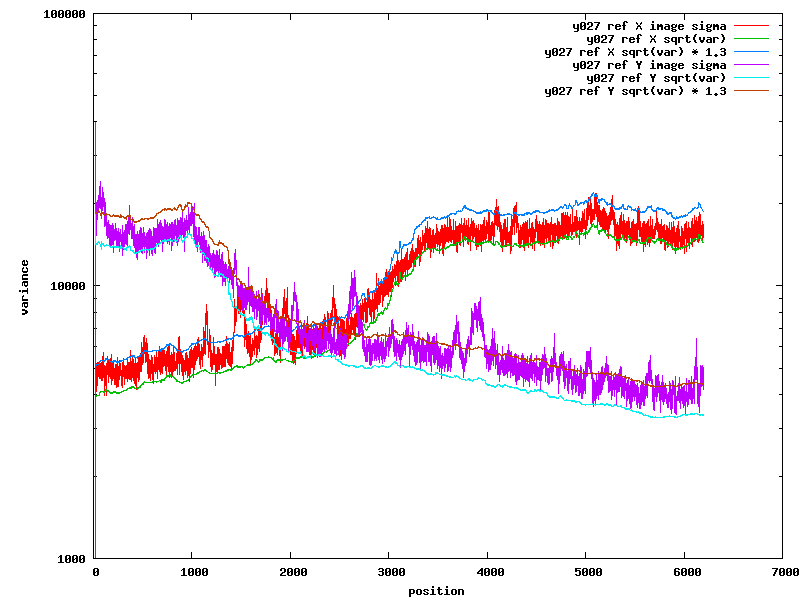
- A1: I chose six horizontal stripes across the image, and calculated the image noise and variance median for each 100-pixel tall sample (partially because I have that code done and easy to use). To remove the effects of stars (which appear as horizontal excursions in the following plot), I used the median absolute deviation as the image noise statistic, converted in the plot to a Gaussian sigma. The variance image was measured using a simple median. No covariance term was applied, although a quick by-eye estimate suggests a covariance term of ~1.1.

- Q2: "If you look at the data, it is clear that for low flux, the X2 levels out at a constant value, and for large flux value it increases. This means that c1=0.0"
- A2: Agreed. Some consideration was made to switch to fitting a chi^2 floor with an exponential rise with flux, but that should yield effectively the same result as the log-log fit used.
- Q3: "What kind of errors do you assume when you fit stamp_chisqr versus stamp_flux?"
- A3: We use no errors on this fit, so they are implicitly weighted equivalently. This is certainly why the fit is biased when low-flux/high chi^2 points are included (such as in stacking_coverage.20130307/fit.0.png). The quick answer would be to use Poissonian error estimates, which would reduce the weight of these outliers. I think the log-log fits reduce the weights of these outliers more (log10(~200)/log10(~30) < sqrt(~200)/sqrt(~30)).
2013-04-19
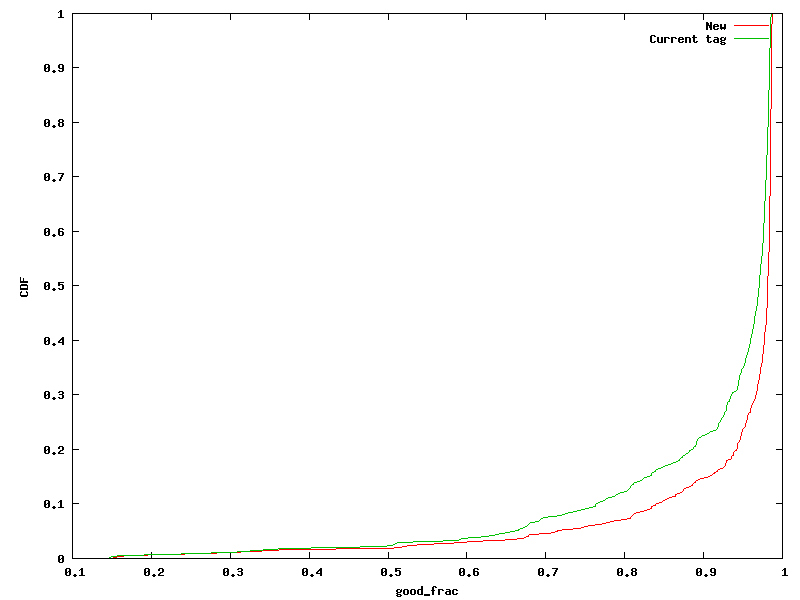
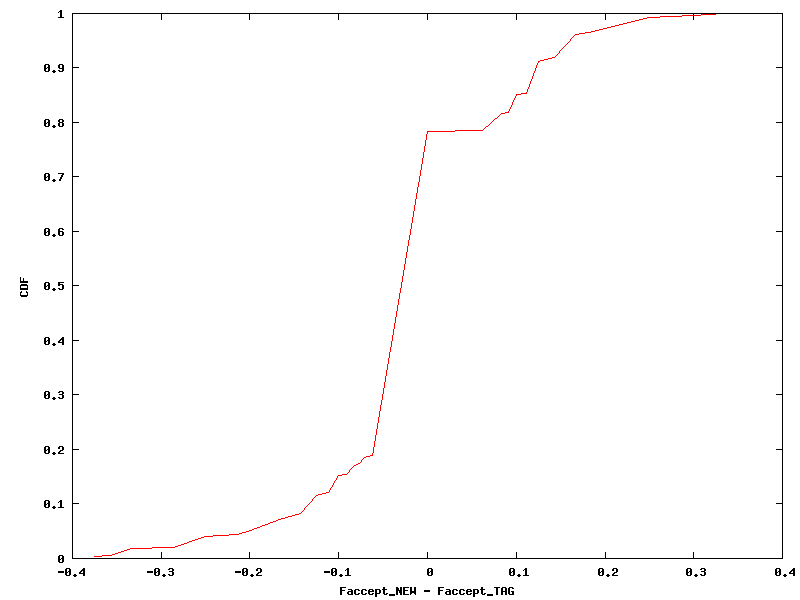
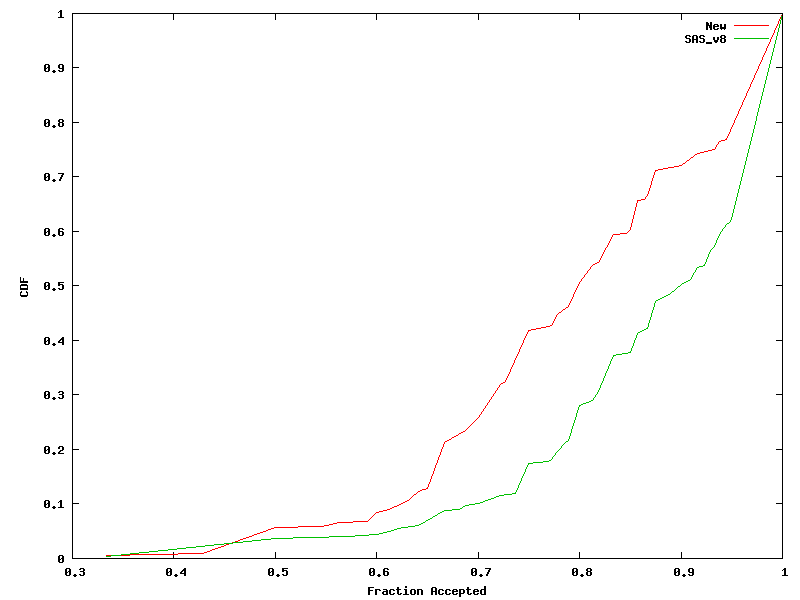
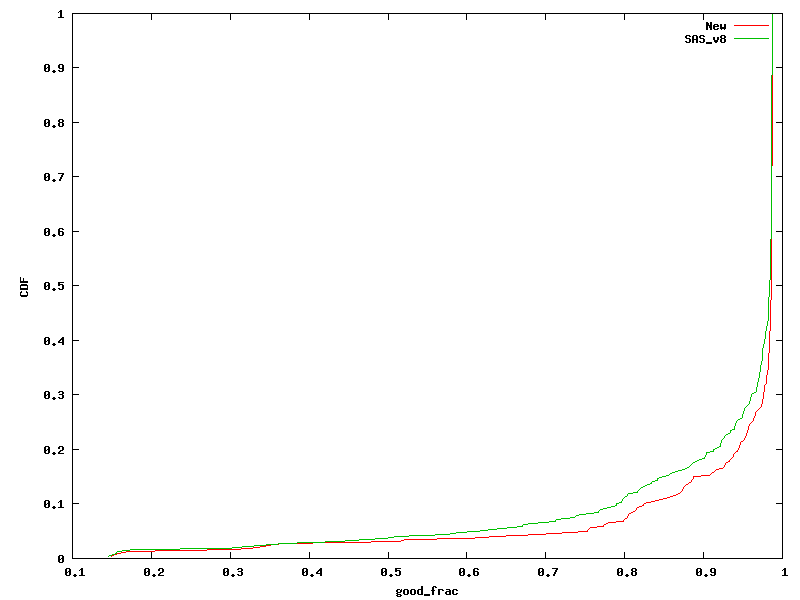
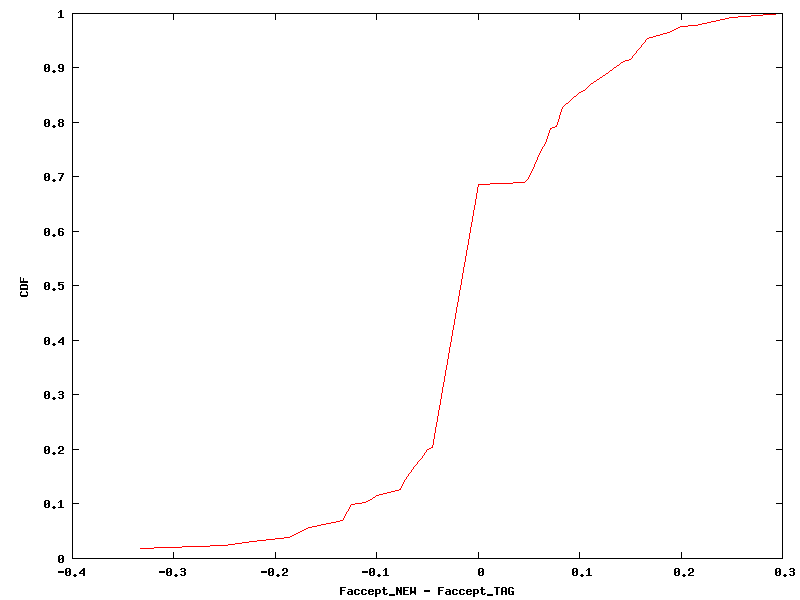
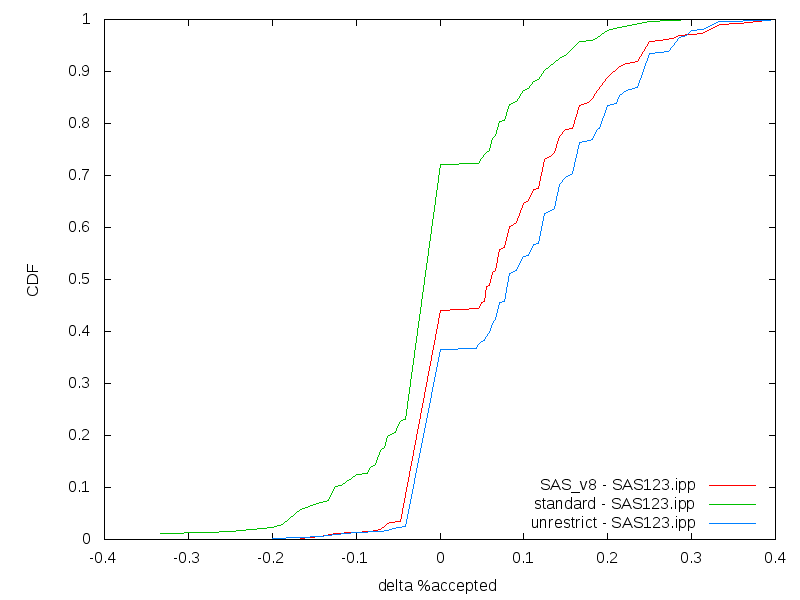
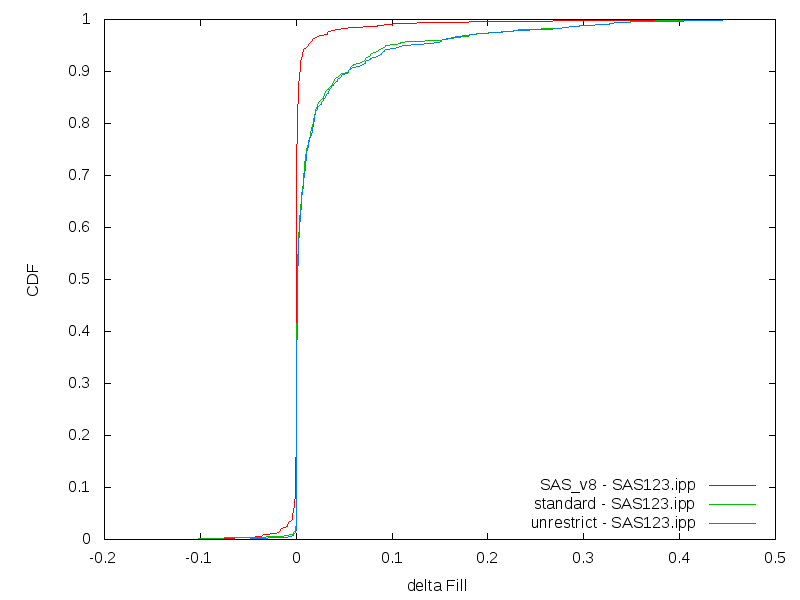
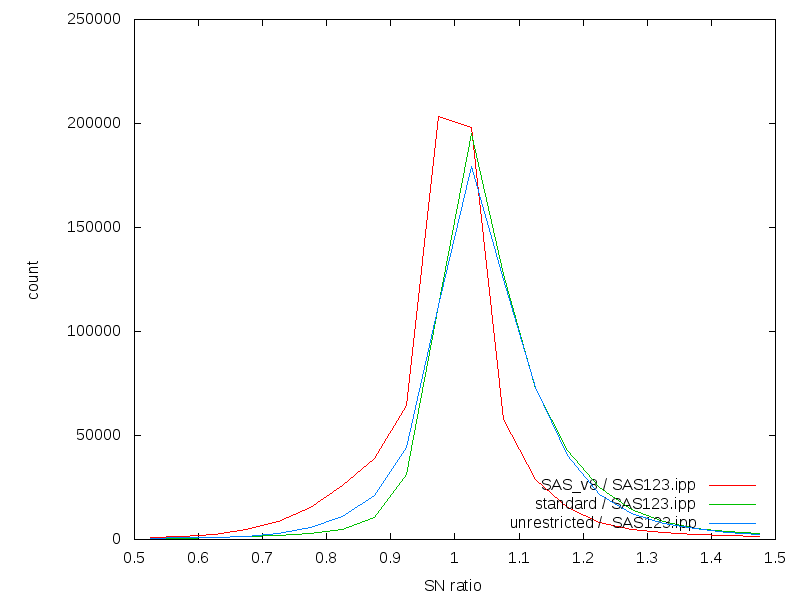
Comparison of SAS processing with current tag and with proposed updates. The first two columns show the apples-to-apples comparison of the current IPP tag and the proposed changes to the trunk. This shows that the improvement in the input rejection is roughly equal in the two versions of the code, with the SAS123 showing a slight favor to the proposed changes (30% improved input fraction compared with 20% that did not). The increase in the fill factor is largely a result of switching the safety flag to false, and not due to the increase in input number. The final column shows the comparison between the proposed changes and the original SAS_v8 processing from 2012-07-19. This processing did not have the stack input filtering enabled to the degree it currently is, and as a result, only failures in the PSF-matching phase contribute to the input rejection. Without this filtering, the fraction of inputs used is obviously higher. This raises the question of whether input filtering is really helpful for 3pi stacks.
| SAS12 tag vs proposed | SAS123 tag vs proposed | SAS123 SAS_v8 vs proposed | |
| Fill factor |  |  | 
|
| Fraction of inputs accepted |  |  | 
|
| Difference in input fraction |  |  | 
|
2013-04-16 A
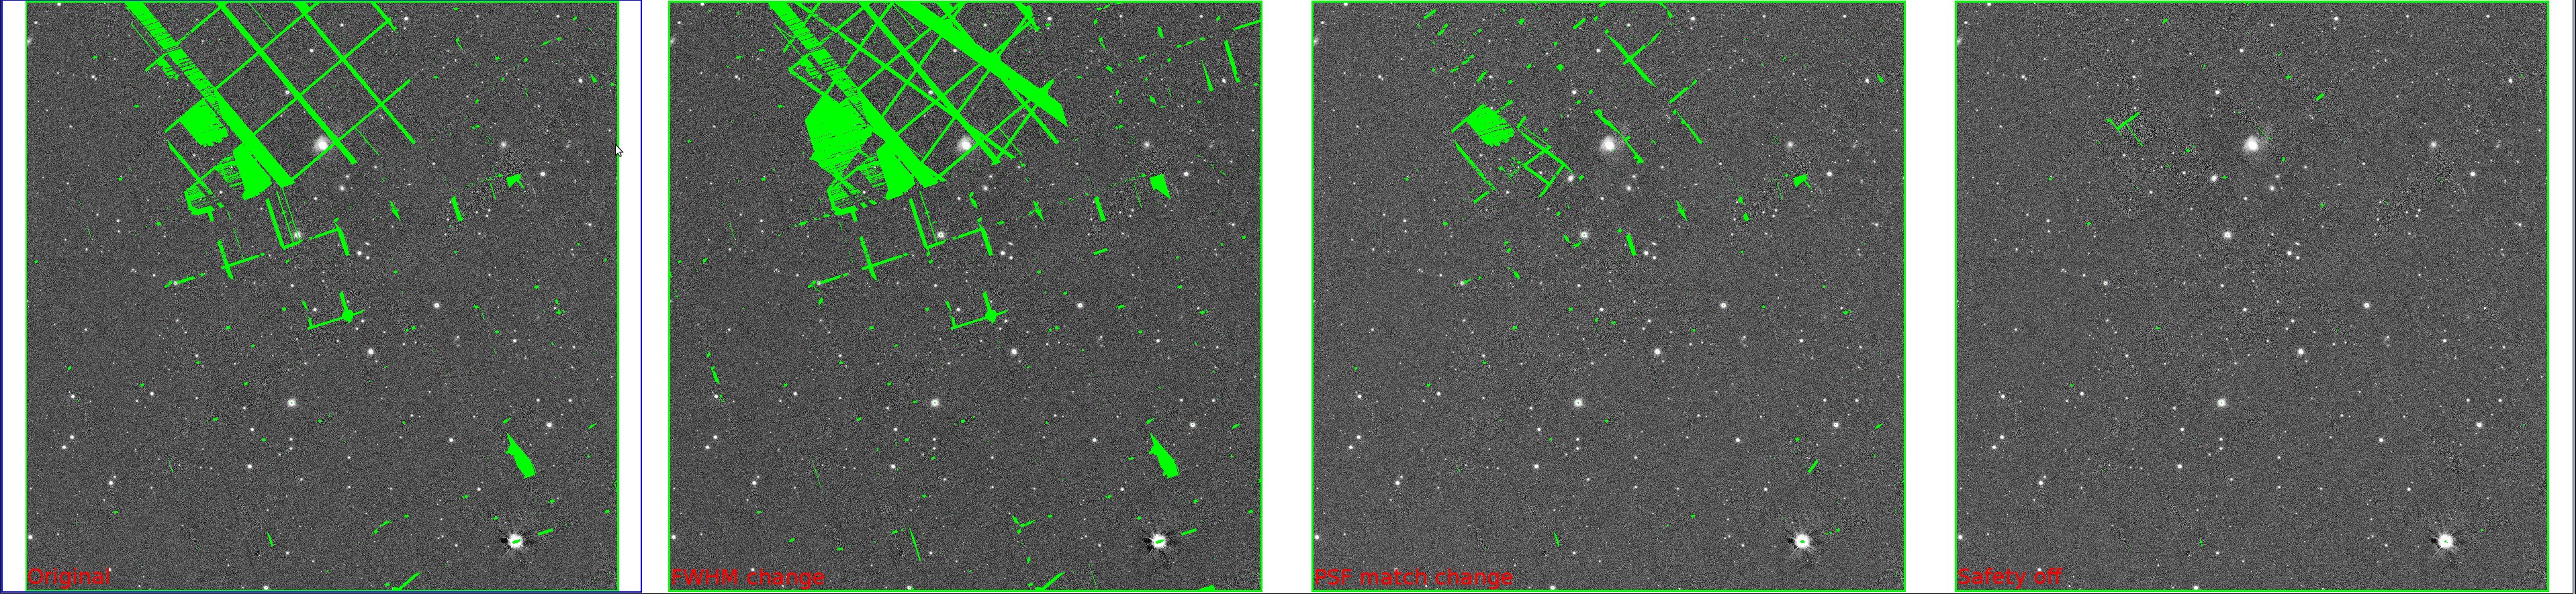
I was able to track down the quadratic fit problem as a result of fitting data with outliers that span many orders of magnitude. I put together a quick hack by taking the logarithm of the chi^2 and flux values, and fitting the quadratic to that. This greatly reduces the scatter found, and provides better fits to the actual data. The following comparison image shows the original stack combination, the reduction with the improved input FWHM cuts (which introduced the chi^2 cut issue), the reduction with this logarithm hack, and finally a result with all of the previous improvements but now with SAFE = F.

2013-04-16
While testing the input FWHM cut, I discovered that an image that appeared valid by eye was being flagged during the PSF matching stage as having a overly deviant chi^2 value. A study of the code revealed that the chi^2 value used is calculated in the following way:
- For all valid stamps in the PSF match, the flux and squared residual are fit with a quadratic function (x0 + x1 * flux + x2 * flux^2).
- This quadratic function is subtracted from the squared residual, providing a flux-neutral measurement of the squared residuals.
- The RMS scatter of these remaining residuals is saved as the chi^2 value for the PSF match (there's a sum over all used kernels, but the example case has only a single kernel).
The following table shows the set of PSF match values, along with the parameters of the quadratic function. This table shows that we seem to be needlessly matching PSFs for images already rejected at the input stage. In addition, there appear to be 2 iterations of this function (pmSubtractionRejectStamps) being called for images 7+.
| Nstamp | mean | rms | x0 | x1 | x2 | Image | Rejected? |
| 27 | -1e-06 | 60.7719 | 19.8792 | 0.000116288 | -9.31452e-13 | 0 | |
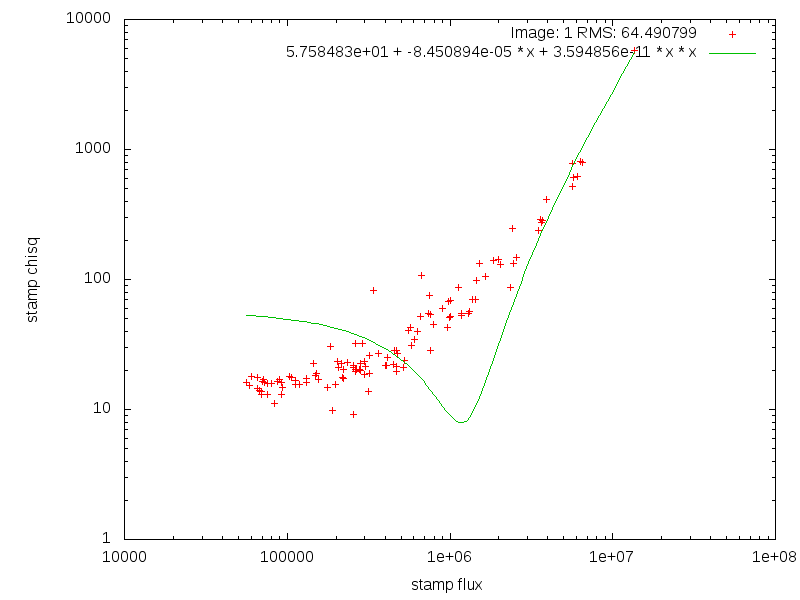
| 119 | 1e-06 | 64.4908 | 57.5848 | -8.45089e-05 | 3.59486e-11 | 1 | |
| 26 | -1e-06 | 43.3212 | 27.068 | 5.53666e-05 | 1.7642e-13 | 2 | |
| 107 | -2e-05 | 2756.68 | 1273.49 | -0.00181565 | 1.34383e-10 | 3 | At Input Stage |
| 106 | -9e-06 | 1105.5 | 614.941 | -0.000711782 | 1.01758e-10 | 4 | Yes |
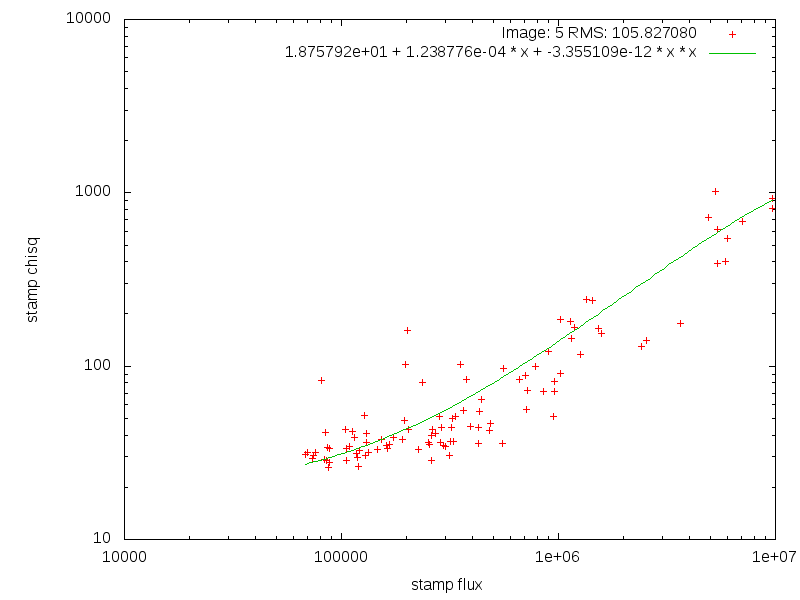
| 102 | -1e-06 | 105.827 | 18.7579 | 0.000123878 | -3.35511e-12 | 5 | At Input Stage |
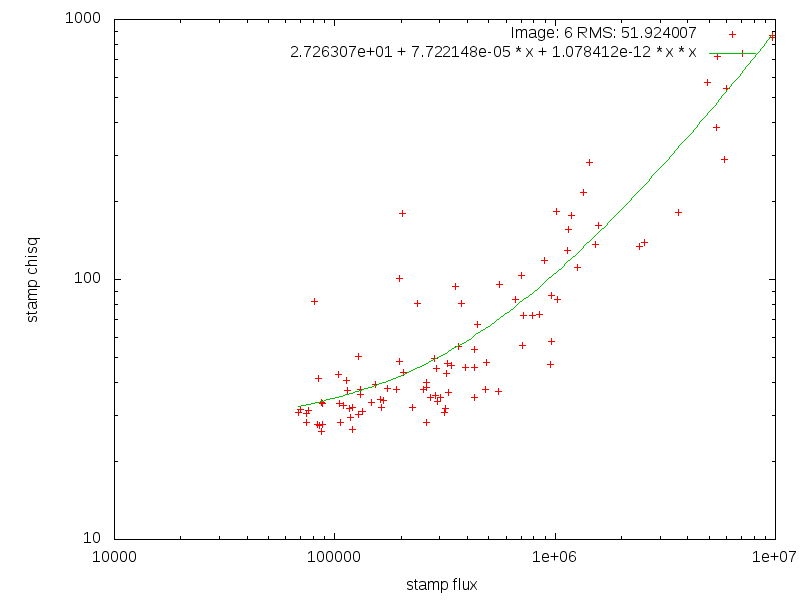
| 101 | -0 | 51.924 | 27.2631 | 7.72215e-05 | 1.07841e-12 | 6 | |
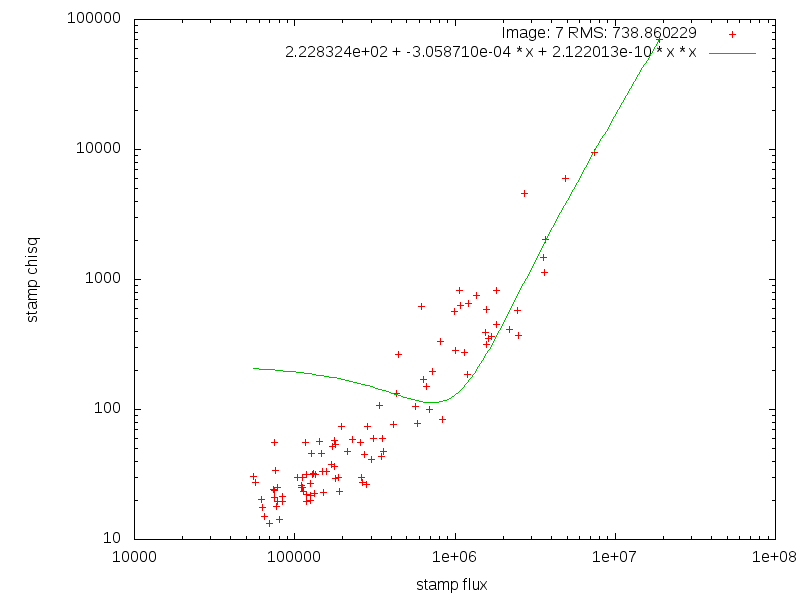
| 100 | -6e-06 | 738.86 | 222.832 | -0.000305871 | 2.12201e-10 | ||
| 99 | 8e-06 | 273.861 | 95.194 | -0.000156691 | 2.03263e-10 | 7 | Yes |
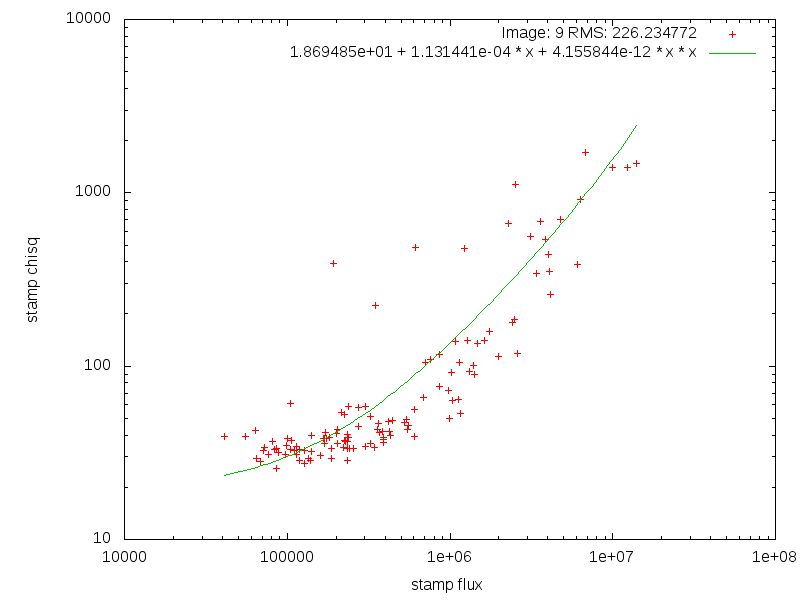
| 124 | 4e-06 | 226.235 | 18.6949 | 0.000113144 | 4.15584e-12 | ||
| 122 | 2e-06 | 92.0136 | 18.5325 | 0.000110472 | 3.66559e-13 | 8 | |
| 123 | 1e-06 | 135.964 | -1.48911 | 0.000144198 | -2.92106e-12 | ||
| 121 | 1e-06 | 77.5818 | 7.60706 | 0.000104179 | 7.44259e-14 | 9 | |
| 103 | 3e-06 | 330.224 | -70.9388 | 0.000411208 | -5.42577e-12 | ||
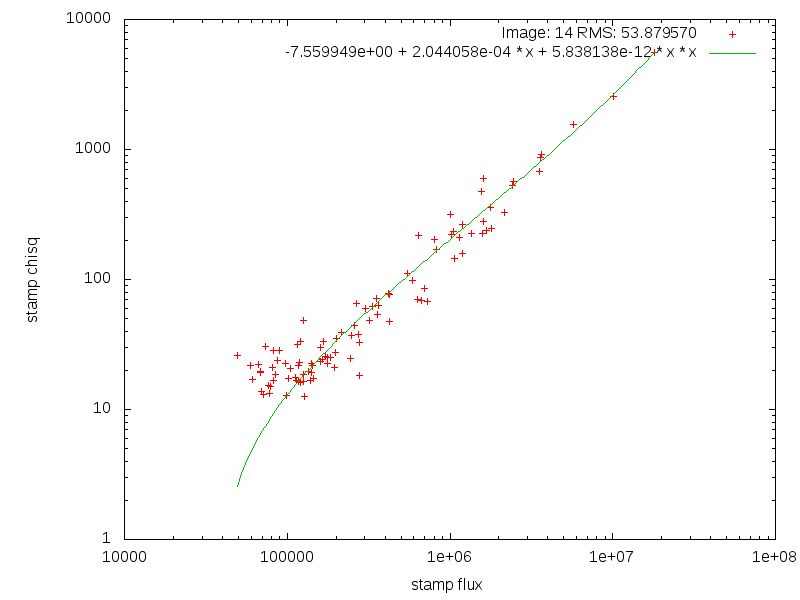
| 101 | -3e-06 | 53.8796 | -7.55995 | 0.000204406 | 5.83814e-12 | 10 | |
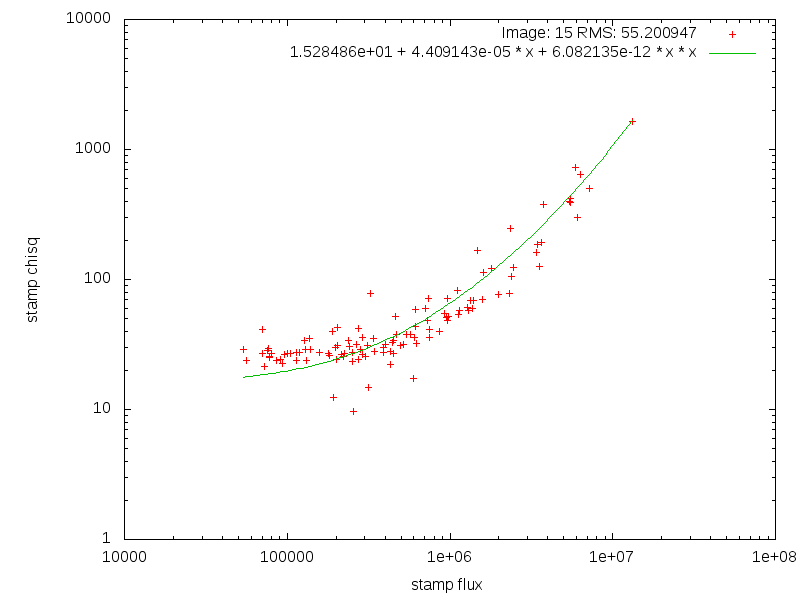
| 116 | 0 | 55.2009 | 15.2849 | 4.40914e-05 | 6.08214e-12 | ||
| 116 | -0 | 23.573 | 32.1768 | 1.87319e-06 | 8.4501e-12 | 11 |
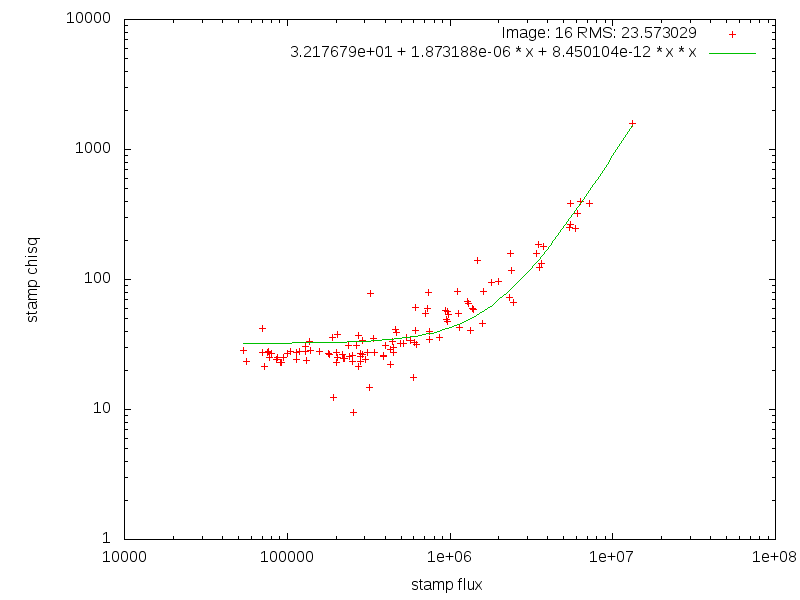
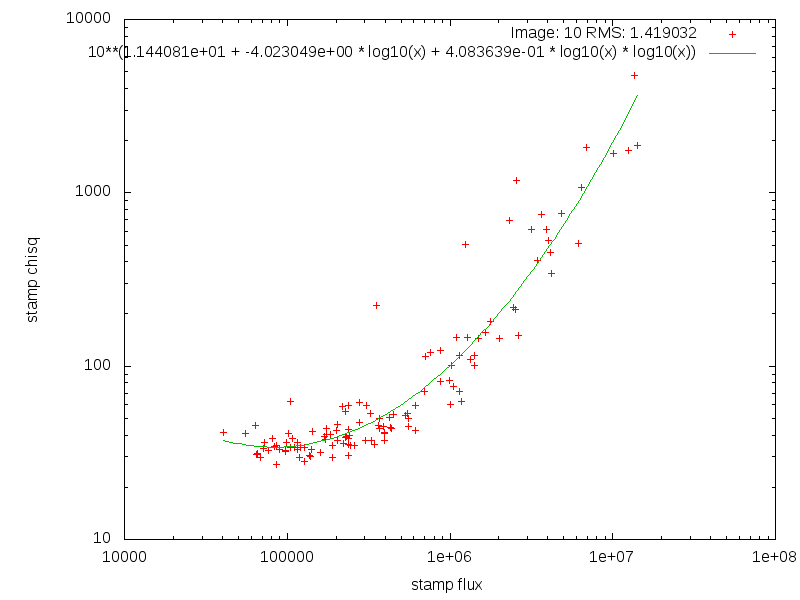
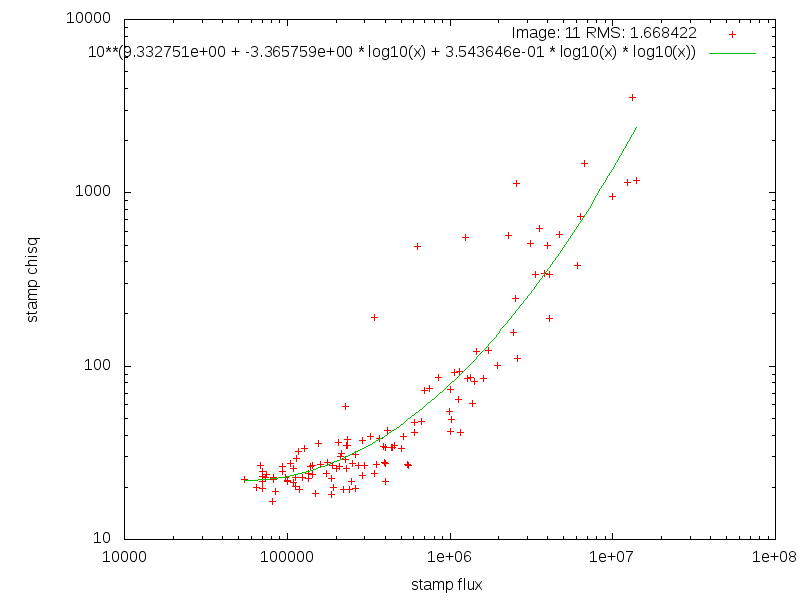
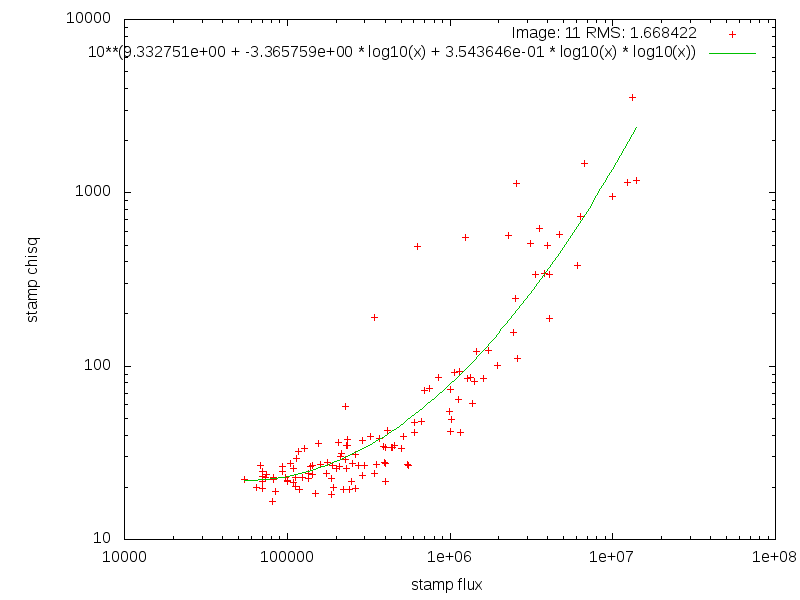
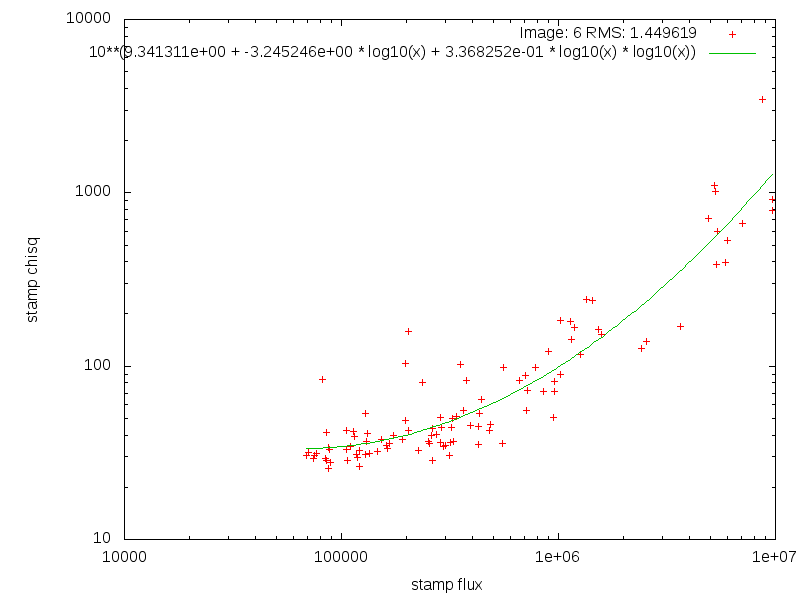
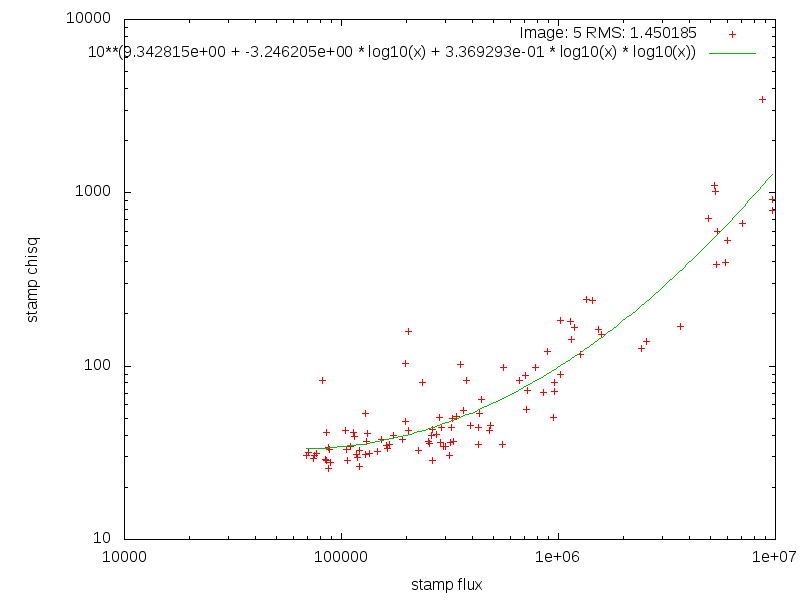
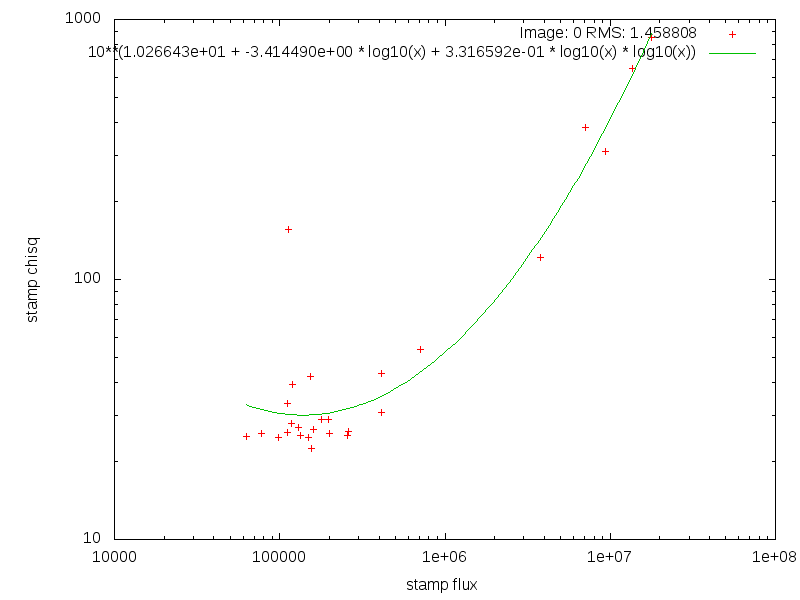
We can now plot up the data and quadratic fits to validate their quality. These plots clearly point that the large chi^2 values being used to reject input exposures at the PSF matching stage are caused by poor quadratic fits to relatively well constrained data. This supports the "by-eye" assessment that the images being rejected do not look like they should be rejected.
Comparing polynomial fits from IPP with external code, it appears that the assumption that chisq(flux) is a well-behaved quadratic function is not necessarily true. Fitting a quadratic to log10(chisq(log10(flux))) looks to provide a better fit to the data trend.
| Image | Plot | Logfit Plot |
| 0 |  | 
|
| 1 |  | 
|
| 2 |  | 
|
| 3 |  | 
|
| 4 |  | 
|
| 5 |  | 
|
| 6 |  | 
|
| 7a |  | 
|
| 7b |  | 
|
| 8a |  | 
|
| 8b |  | 
|
| 9a |  | 
|
| 9b |  | |
| 10a |  | 
|
| 10b |  | 
|
| 11a |  | 
|
| 11b |  |
2013-04-08
The new proposed algorithm for the initial ppStack FWHM cuts uses a Gaussian mixture model analysis to attempt to determine the best separation between a possible two component distribution.
- If Punimodal > 0.5 (this distribution is best described by a single Gaussian mode); limit = MAX(FWHM_i)
- Otherwise, assume two Gaussians best describe it
- If pi1 > pi2 (the smaller FWHM group has the majority of the samples); limit = m1 + k * sigma1
- If pi2 > pi1 (the larger FWHM group has the majority of the samples); limit = m2 + k * sigma2
- If abs(pi1 - pi2) < separation threshold (taken as ~0.2. assume this is nearly unimodal); limit = m2 + k * sigma2
- If N <= 4; limit = MAX(FWHM_i)
- If limit > high_threshold; limit = high_threshold
- If limit < low_threshold; limit = low_threshold
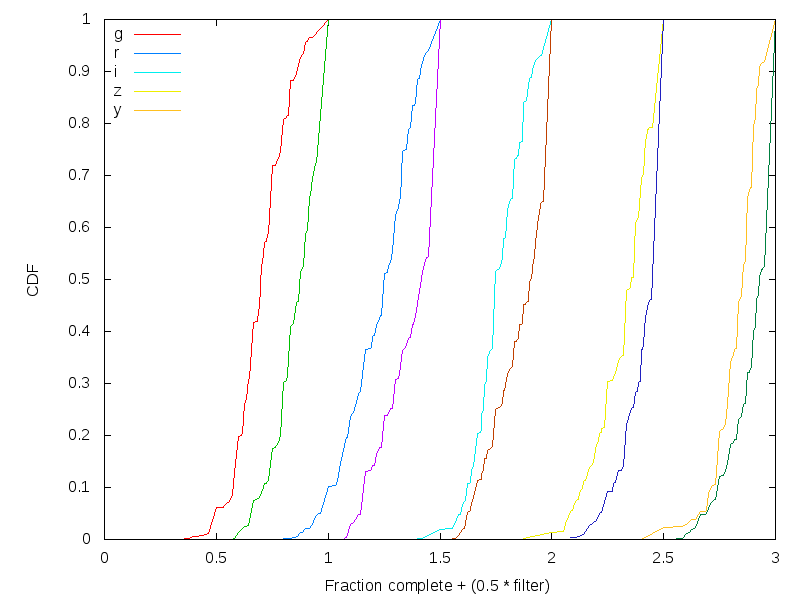
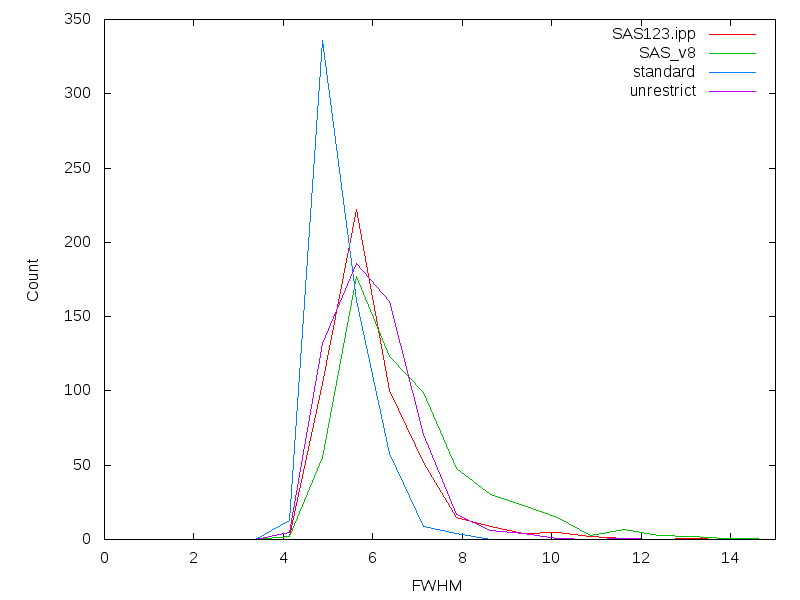
The results of this algorithm change are shows below, displaying the prior results along with this proposed change. The first figure shows the fraction of input images accepted into the stack for each filter (g,r,i,z,y). The second shows the distribution of the FWHM limits.


2013-04-04
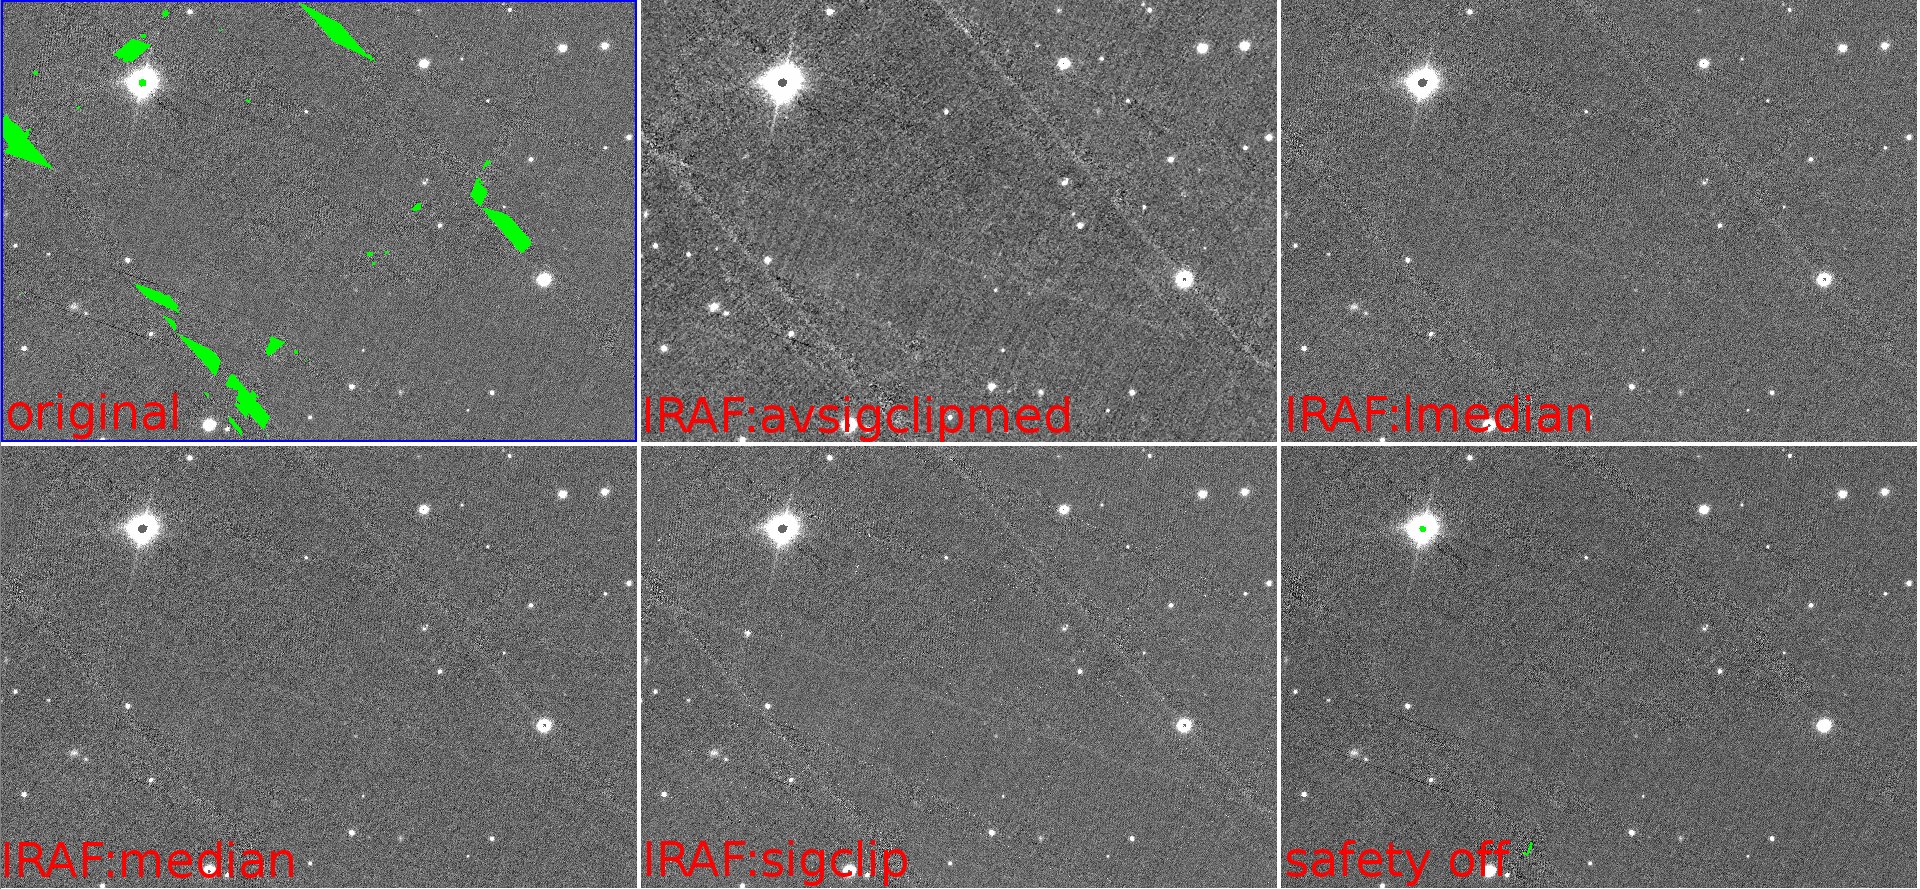
I have the first set of ppStack changes in place and merged to the trunk. This includes the fix for the PSF target that was resulting in excess detections. I have run a test on the same SAS stack that Ken and Heather were using for IRAF tests. This test has the SAFE flag set to FALSE, allowing single inputs to contribute.

2013-03-07
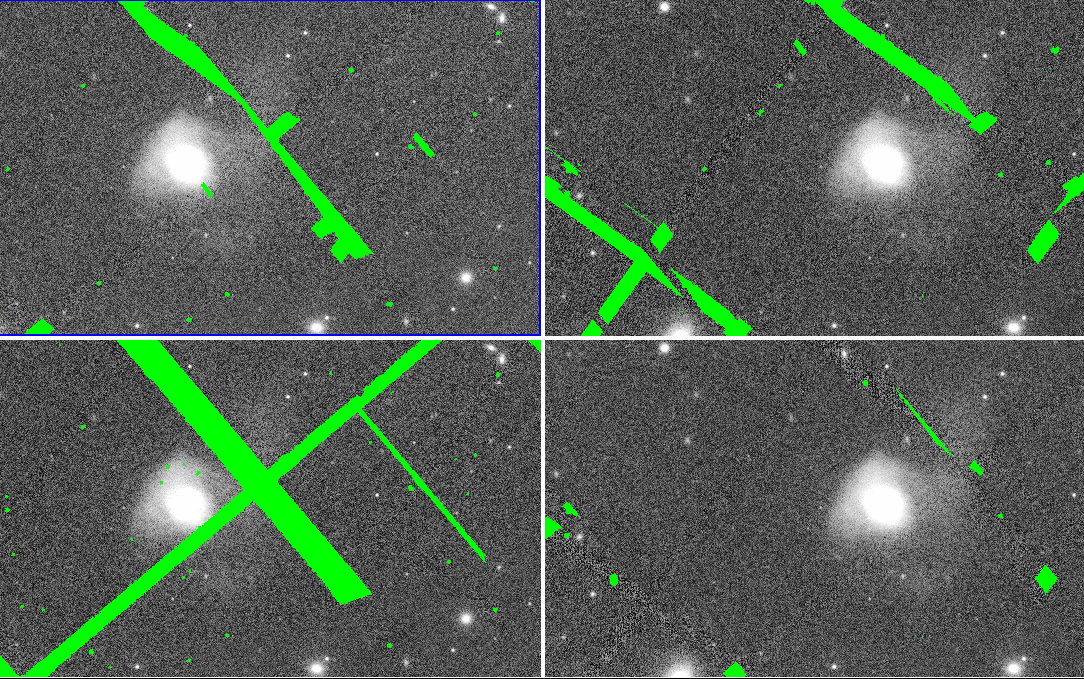
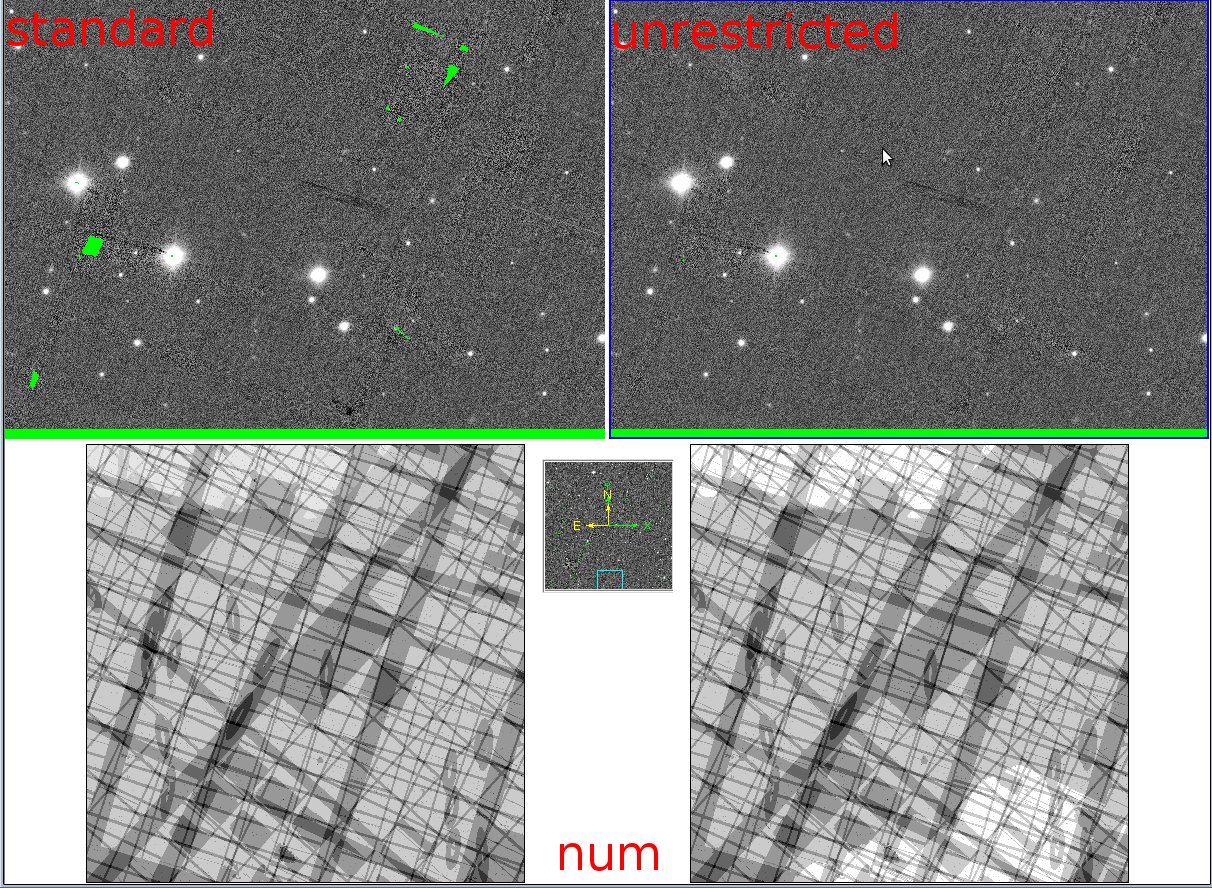
For the Arp 220 example, of the six input warps that contain the galaxies, two are excluded due to large FWHM, with another warp having a FWHM close to the hard limit of 7.5. This input was excluded in the original processing, but not in my reprocessing of the warps (FWHM for the reprocessing was 7.48). Because of this, only three (four) warps are available. We currently enforce the "safe combination" rules, which do not allow a pixel to be populated from only one input exposure. The following images show the input warps that contain Arp 220, with the top showing the reprocessed set, and the bottom showing the original warps. The red X show which inputs were excluded due to their FWHM being large. Below that is a comparison of the stacks obtained for these warps with the default combination (left panels) and with the FWHM limit set to 100, which allows all warps to contribute (right panels).


Attachments (92)
- limits.png (9.0 KB ) - added by 14 years ago.
- fractions.png (9.2 KB ) - added by 14 years ago.
- iraf_ppstack_comp.jpg (769.5 KB ) - added by 14 years ago.
- 23_a2.png (1.3 MB ) - added by 14 years ago.
- 23_a1.png (1.1 MB ) - added by 14 years ago.
- fit.0.png (7.6 KB ) - added by 14 years ago.
- fit.16.png (8.2 KB ) - added by 14 years ago.
- fit.6.png (8.4 KB ) - added by 14 years ago.
- fit.5.png (8.3 KB ) - added by 14 years ago.
- fit.4.png (8.8 KB ) - added by 14 years ago.
- fit.3.png (8.4 KB ) - added by 14 years ago.
- fit.2.png (7.7 KB ) - added by 14 years ago.
- fit.1.png (8.7 KB ) - added by 14 years ago.
- fit.7.png (8.5 KB ) - added by 14 years ago.
- fit.8.png (8.6 KB ) - added by 14 years ago.
- fit.9.png (8.7 KB ) - added by 14 years ago.
- fit.14.png (8.6 KB ) - added by 14 years ago.
- fit.13.png (8.7 KB ) - added by 14 years ago.
- fit.12.png (8.6 KB ) - added by 14 years ago.
- fit.11.png (8.7 KB ) - added by 14 years ago.
- fit.10.png (8.6 KB ) - added by 14 years ago.
- fit.15.png (8.4 KB ) - added by 14 years ago.
- coverage_comparison.jpg (1.5 MB ) - added by 14 years ago.
- logfit.7.png (9.0 KB ) - added by 14 years ago.
- logfit.8.png (9.0 KB ) - added by 14 years ago.
- logfit.9.png (8.9 KB ) - added by 14 years ago.
- logfit.10.png (8.9 KB ) - added by 14 years ago.
- logfit.11.png (9.1 KB ) - added by 14 years ago.
- logfit.11.2.png (9.1 KB ) - added by 14 years ago.
- logfit.6.png (8.6 KB ) - added by 14 years ago.
- logfit.5.png (8.6 KB ) - added by 14 years ago.
- logfit.0.png (8.0 KB ) - added by 14 years ago.
- logfit.1.png (8.7 KB ) - added by 14 years ago.
- logfit.2.png (7.9 KB ) - added by 14 years ago.
- logfit.3.png (8.8 KB ) - added by 14 years ago.
- logfit.4.png (8.9 KB ) - added by 14 years ago.
- logfit.14.png (9.0 KB ) - added by 14 years ago.
- logfit.13.png (8.9 KB ) - added by 14 years ago.
- logfit.12.png (9.0 KB ) - added by 14 years ago.
- logfit.15.png (8.6 KB ) - added by 14 years ago.
- sas12_freject.png (5.0 KB ) - added by 13 years ago.
- sas12_coverage.png (4.1 KB ) - added by 13 years ago.
- sas123_freject2.png (5.1 KB ) - added by 13 years ago.
- sas12_compare.png (4.5 KB ) - added by 13 years ago.
- sas123_freject.png (5.0 KB ) - added by 13 years ago.
- sas123_coverage2.png (4.1 KB ) - added by 13 years ago.
- sas123_compare.png (4.5 KB ) - added by 13 years ago.
- sas123_coverage.png (4.0 KB ) - added by 13 years ago.
- sas123_compare2.png (4.5 KB ) - added by 13 years ago.
- stacking_noise_match.png (10.4 KB ) - added by 13 years ago.
- circularized.png (7.4 KB ) - added by 13 years ago.
- circular_issue.jpg (58.4 KB ) - added by 13 years ago.
- depth_comp.jpg (421.5 KB ) - added by 13 years ago.
- sn_rat.png (10.4 KB ) - added by 13 years ago.
- fwhm_hist.png (9.1 KB ) - added by 13 years ago.
- pixel_num.png (8.6 KB ) - added by 13 years ago.
- acceptance.png (8.7 KB ) - added by 13 years ago.
- fwhm.png (8.2 KB ) - added by 13 years ago.
- fill_factor.png (7.7 KB ) - added by 13 years ago.
- SNrat_hist.png (9.3 KB ) - added by 13 years ago.
- y027ref.jpg (186.4 KB ) - added by 13 years ago.
- y027comp.jpg (186.4 KB ) - added by 13 years ago.
- i061_psf.png (6.5 KB ) - added by 13 years ago.
- i055_psf.png (6.3 KB ) - added by 13 years ago.
- y027_psf.png (5.6 KB ) - added by 13 years ago.
- i061ref.jpg (187.0 KB ) - added by 13 years ago.
- i061comp.jpg (212.5 KB ) - added by 13 years ago.
- i055ref.jpg (229.0 KB ) - added by 13 years ago.
- i055comp.jpg (228.8 KB ) - added by 13 years ago.
- i041ref.jpg (199.1 KB ) - added by 13 years ago.
- i041comp.jpg (223.9 KB ) - added by 13 years ago.
- i041_psf.png (6.2 KB ) - added by 13 years ago.
- y027_fpdepth.png (9.7 KB ) - added by 13 years ago.
- y027_fp.png (8.2 KB ) - added by 13 years ago.
- i061_fpdepth.png (9.7 KB ) - added by 13 years ago.
- i061_fp.png (9.4 KB ) - added by 13 years ago.
- i055_fpdepth.png (10.0 KB ) - added by 13 years ago.
- i055_fp.png (8.6 KB ) - added by 13 years ago.
- i041_fpdepth.png (9.7 KB ) - added by 13 years ago.
- i041_fp.png (9.7 KB ) - added by 13 years ago.
- i055ref_var.png (10.6 KB ) - added by 13 years ago.
- i055ref_var.2.png (10.6 KB ) - added by 13 years ago.
- i061comp_var.png (11.5 KB ) - added by 13 years ago.
- i055comp_var.png (10.6 KB ) - added by 13 years ago.
- i041ref_var.png (10.8 KB ) - added by 13 years ago.
- i041comp_var.png (10.5 KB ) - added by 13 years ago.
- y027ref_var.png (13.2 KB ) - added by 13 years ago.
- y027comp_var.png (12.6 KB ) - added by 13 years ago.
- i061ref_var.png (11.3 KB ) - added by 13 years ago.
- V2_comparisons.png (14.2 KB ) - added by 13 years ago.
- y027_fp_v2test.png (11.3 KB ) - added by 13 years ago.
- i055_fp_v2test.png (10.6 KB ) - added by 13 years ago.