Peak Culling in psphot
We have a problem with large numbers of false positive detections in some images with high background and large PSFs. The initial analysis of this problem is discussed on the following page: Background Model and Oversubtraction.
On that page, I present an attempt to detect and filter such bad detections using the ratio of flux in a core aperture to the kron flux. This seemed to work well in the sample cases, but on wide application, it is too likely to reject obvious galaxies. The optimal rejection parameters are probably too sensitive to the details of the image.
I have implemented an alternative technique which works similarly for the case of the very bad background (o5579g0223o.XY63), while retaining the obvious galaxies. The parameters for this alternative method should not be as sensitive as the core/kron rejection attempt.
In psphot, the initial detection pass is performed by detecting peaks on a 'significance image'. The significance image is constructed by smoothing the signal image with the PSF and the variance with the PSF2, and then calculating S/N = Image / sqrt(Variance) (In fact we calculate the square of S/N, but this is a detail).
After peaks have been detected, we generate a set of 'footprints' for each peak: these are contours at an isophotal level (defined as a multiple of the sky noise) which contain each peak. We then attempt to cull insignificant peaks by examining their neighbors in the same footprint. A peak is deemed to be insignificant if the path from that peak to the brighter peaks in the same footprint require us to traverse a col (local saddle) which is not significantly lower than the peak itself.
In the past, the test for the col significance has been made using the raw (unsmoothed) signal and variance images. However, as defined, any col is significant if it passes below a minimum threshold, defined as a number of sigma above sky. The result of this definition is that any low-significance peak in a region of low-significance sky flux excursions will always be considered 'significant'.
In the cases illustrated on the previous page (Background Model), the background excursions are small, but are made significant by smoothing the image when generating the detection image. Typically, the variations in background in the example are a few to 10 DN, while the sky noise is ~35DN. The only reason peaks are detected in this region is that image is smoothed with a PSF of width ~10 pixels, pumping up the S/N in the sky, or equally, driving the sky noise from 35DN down to ~1.5DN. At this level, 10DN excursions are significant.
My idea is that the smoothed image better represents the significance of the background variations. Thus, if the culling used the smooth signal and variance images, it would probably identify some or many of these low-significance detections as insignificant relative to their neighbors.
This new technique works roughly as well on o5579g0223o.XY63 used in the earlier discussion. Below is a region from o5579g0223o.XY63 with a small amount of smoothing to enhance the detections. Red boxes mark (unculled) detections using the default technique for culling on the raw image; Blue boxes mark (unculled) detections using the new culling technique with the smoothed image. Clearly, this technique is filtering out many of the insignificant detections from the poorly subtracted background model.

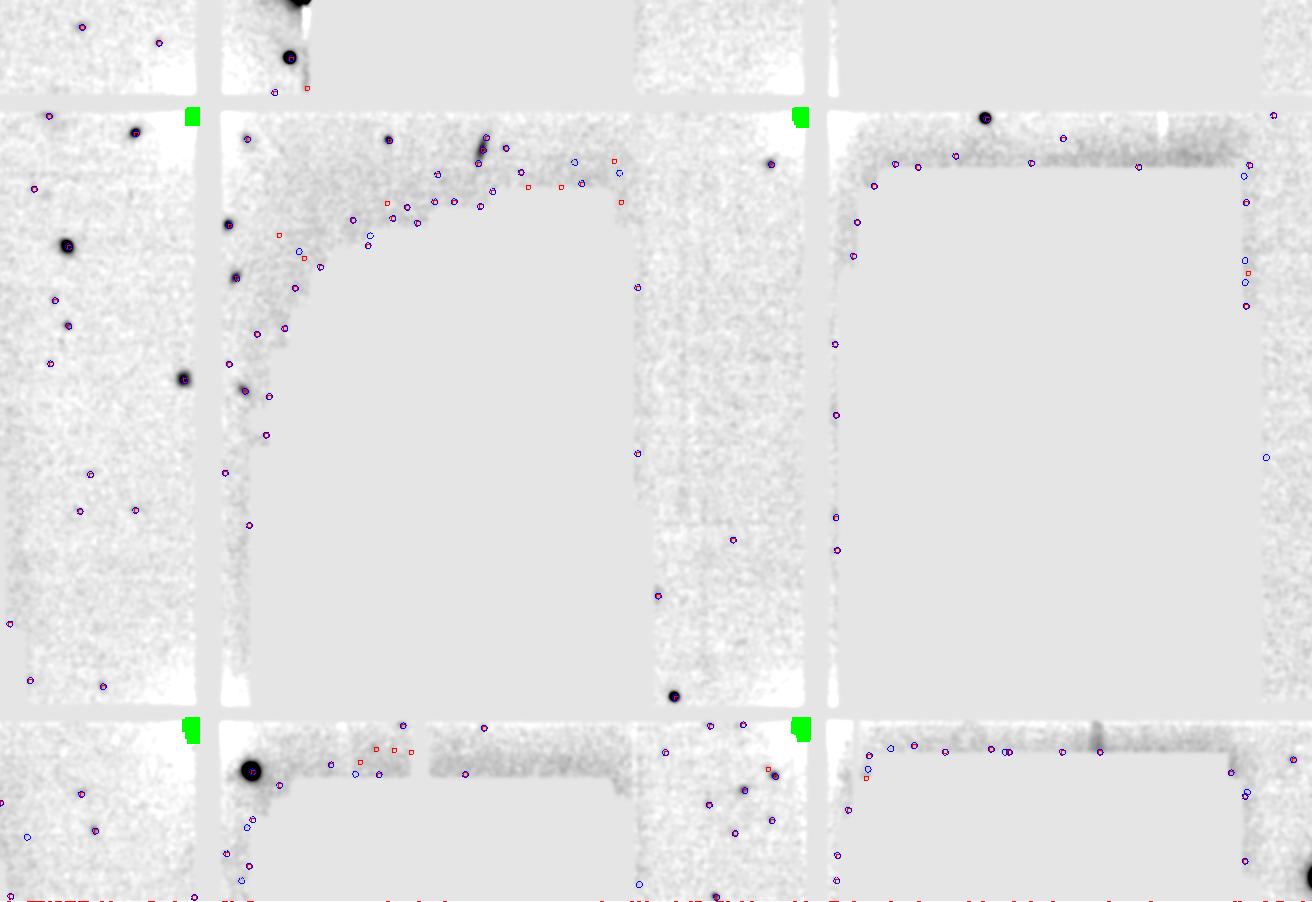
Unfortunately, the technique is not perfect. The two images below show a different image (o5353g0100o.XY20) with somewhat similar features. In this case, the excess flux comes from dark glows in the relatively poor corners (near the area masked for bad CTE and dark current). In this example, these detections are not efficiently culled from these images with the new technique. (The left image is unsmoothed; the right has a 2.0 sigma Gaussian smoothing applied). The difficulty in this case is that these detections land on very low significance fluctuations in the background -- according to the significance image, they are significant (if barely), and the intervening cols are below the minimum threshold. Formally, these are significant.
 | 
|
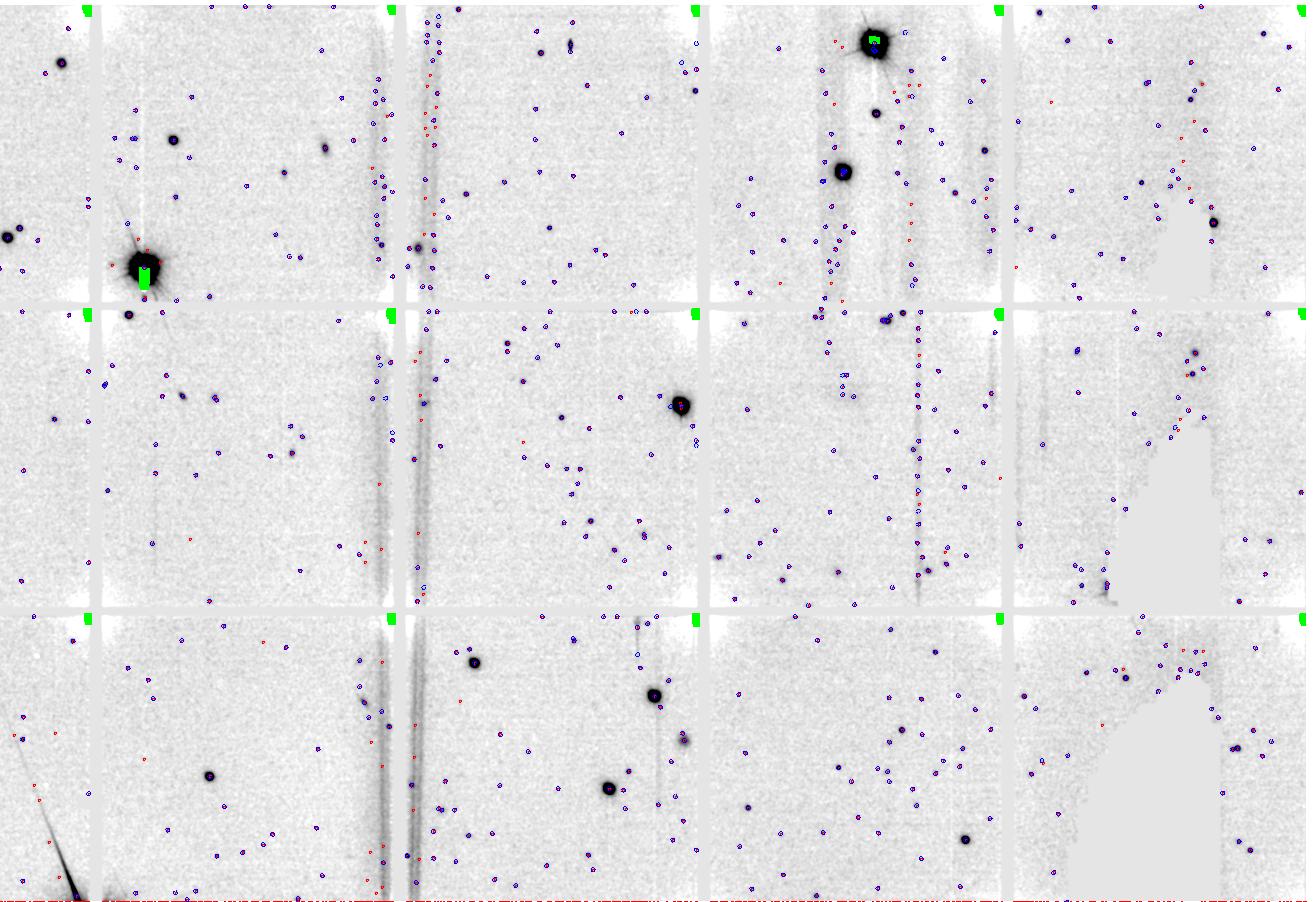
The final image below shows an example of some of the other ugly features in these images: star glints and burntool residuals are the most obvious.

Attachments (4)
- o5579g0223o.XY63.jpg (103.6 KB ) - added by 16 years ago.
- o5353g0100o.XY20.raw.jpg (238.8 KB ) - added by 16 years ago.
- o5353g0100o.XY20.smooth.jpg (72.2 KB ) - added by 16 years ago.
- o5353g0100o.XY20.crud.jpg (179.9 KB ) - added by 16 years ago.
Download all attachments as: .zip